Auto Insights Newsletter | June 2021
Automotive market regains pre-Covid momentum
South Africa’s retail motor sector is gathering momentum and activity is matching or exceeding pre-Covid-19 levels.
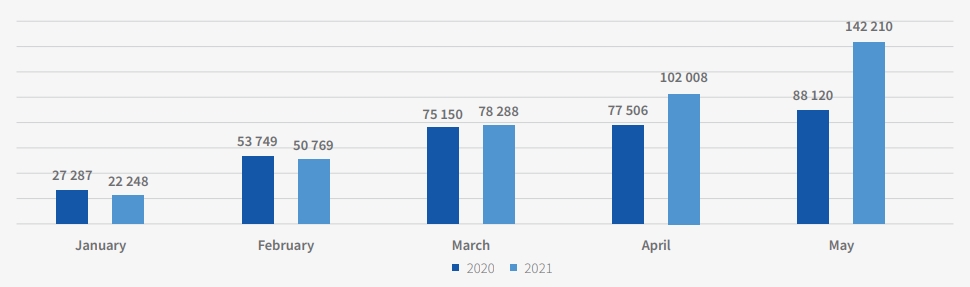
Scans on LIVE were 61.38% higher for the five months to end May 2021 as opposed to the corresponding period last year, when a shell-shocked South Africa was emerging from the hard lockdown.
The scans on LIVE – which indicate an ‘intention to sell’ – suggest momentum in the market has recovered to pre-Covid-19 levels.
Although the start to 2021 was slow, with cumulative volumes at the end of March 2021 just 4.18% higher than the corresponding period in 2020, scans rocketed in May 2021 and were more than 300% up on 2020. This strong May performance laid the foundation for the improvement over the five month period.
Cumulative number scans
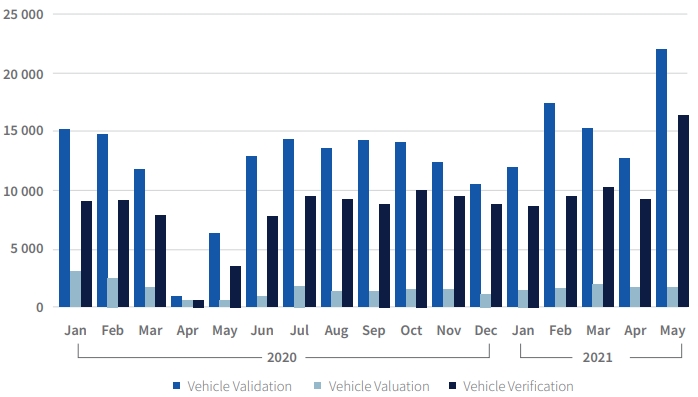
Scans on LIVE are broken down into three distinct products – Verification, Valuation and Validation.
Validations increased dramatically in February 2021, up 44.4% on January 2021. This surge came after Validations tapered off towards the end of 2020 after the post-lockdown strong recovery earlier in the year.
Vehicle Verifications have grown more consistently since lockdown, and by May 2021 were ahead of pre-Covid-19 levels.
Vehicle Valuations make up a smaller portion of LIVE scans and are slowly edging back to pre-Covid-19 levels.
Total scans on LIVE by package type
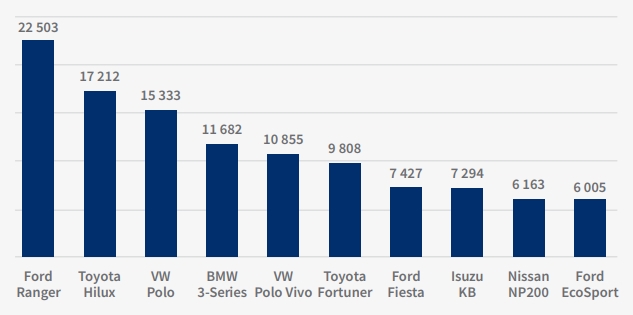
Brand scans
The Ford Ranger is the most popular vehicle in the used market, and naturally, eight of the vehicles on the list also feature on the best-selling new vehicle sales charts from January 2020 to May 2021.
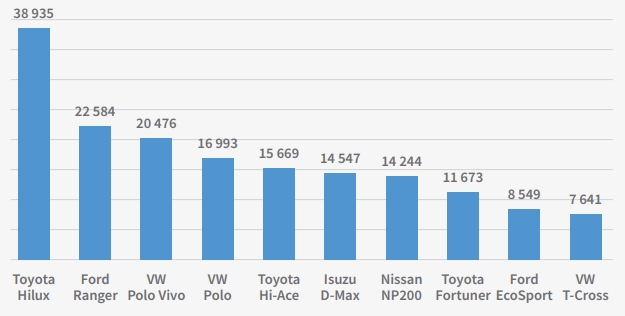
Total scans since January 2020
The presence of the BMW 3-Series on the “Total scans since January 2020” list could suggest an increased willingness to sell vehicles from premium brands and move into either smaller, cheaper vehicles or crossovers.
Most popular new vehicles
(January 2020 - May 2021)
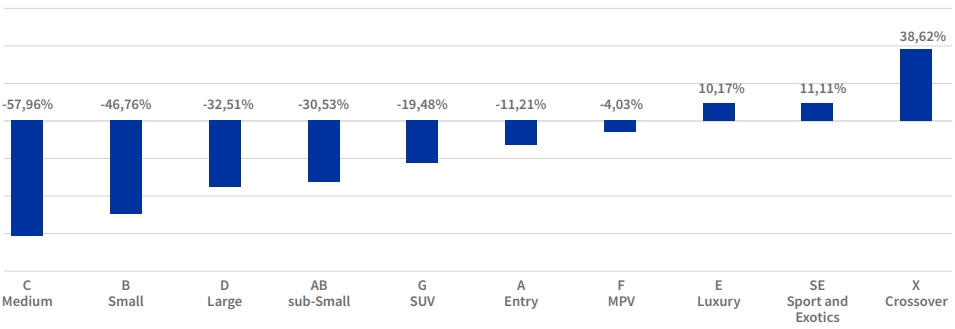
This is indicated by the decline in year-to-date Segment level sales as at end April 2021 (when compared to April 2019 year-to-date sales) of sales in the premium sedan segments (C - Medium, D - Large) being far higher than in the cheaper segments (A - Entry, AB - sub-Small).
The crossover trend is also confirmed with it being the only other segment, apart from the E - Luxury and SE - Sports and Exotics segments, to show positive growth.
Growth in 2021 year to date segment level sales
Signio bounce back
Ratio of current month’s applications relative to same month in previous year
(Value higher than 100% indicates that there were more applications than in the same month of the previous year)
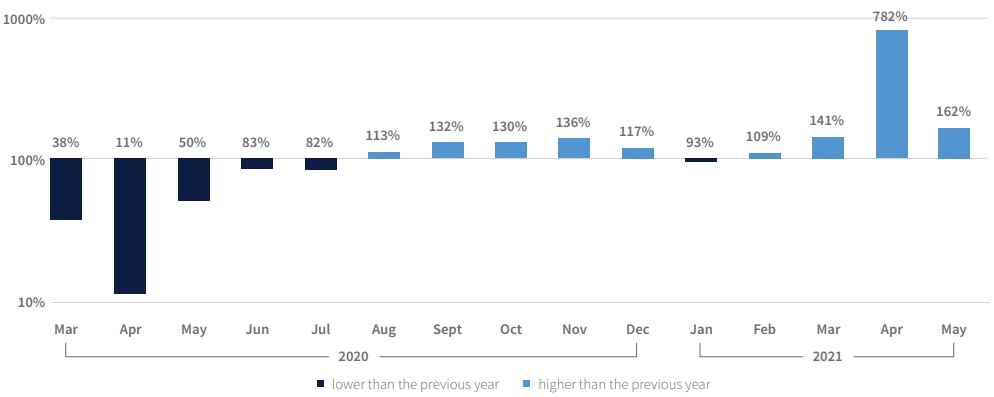
We observe a strong decline in total applications in the first half of 2020, with March and April being the months that were hardest hit by the Covid-19 lockdown. We also observe a quick recovery back to pre-Covid levels in terms of Signio applications, with every month from August to December registering higher application volumes than in the previous year. By September, total applications were more than 30% higher than in September 2019.
After a slow start to 2021, application volumes have continued to increase and are 41% higher in March compared to the same month in 2020 and volumes in 2021 are comparable with 2019. April 2021 showed a huge, and to be expected increase of 782% over April 2020, when dealerships were closed for most of that month.
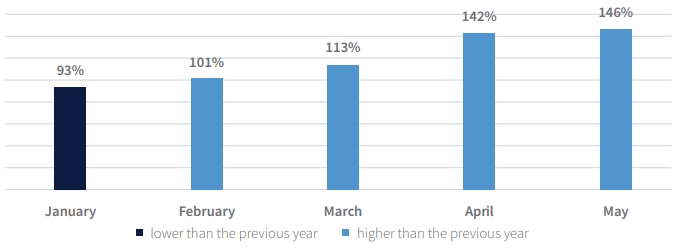
The good growth in March has allowed Signio applications in 2021 to move ahead of 2020. Total applications are 13% higher by the end of March 2021 compared to March 2020.
Total applications are 46% at the end of May 2021 than in May 2020.
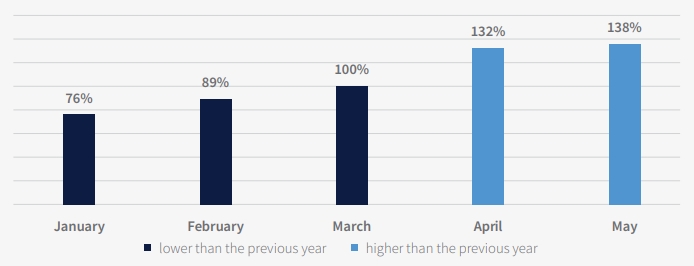
Ratio of cumulative applications in 2021 relative to the same month in previous year
(Value higher than 100% indicates that there were more applications than in the same month of the previous year)
Ratio of current month’s payouts relative to same month in previous year
(Value higher than 100% indicates that there were more payouts than in the same month of the previous year)
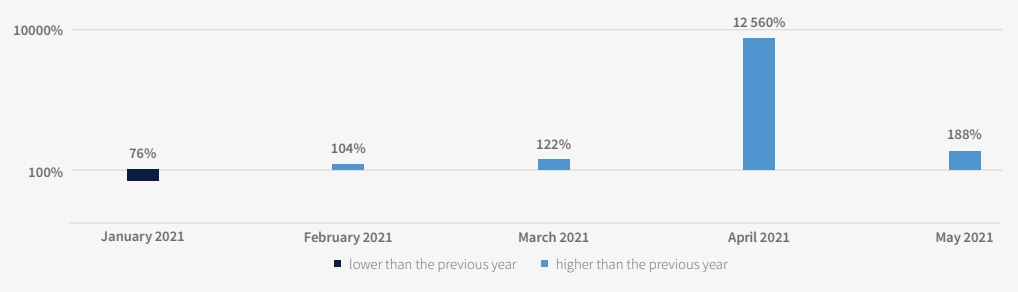
The number of paid out deals on Signio made a quick recovery back to pre-Covid levels in 2020. Payouts suffered a 24% decrease year on year in January, but have recovered after a strong month in March and have recovered to similar levels seen in 2020. Cumulative payouts are 38% higher at the end of May 2021 when compared to May 2020.
Ratio of cumulative payouts in 2021 relative to the same month in previous year
(Value higher than 100% indicates that there were more payouts than in the same month of the previous year)
Cumulative Growth over the year to date.

Solutions that simplify the complex
Our new website makes it easier to navigate and discover a range of Lightstone products and solutions that make it easier for you to do business.

One place to access your subscriptions
We’ve simplified the complex with a single sign on functionality. Simply login and you will have access to all the products that you currently subscribe to. All in one portal.

What’s happening to the old website?
A few links on our new website may redirect you to certain pages on the old website. This is just a temporary solution to ensure legacy users still have access to certain products.
.png)
.png)
.png)
.png)