Property Newsletter | August 2023
Women lead the ownership race
… and catching up to men in buying financed new vehicles
More women own homes in South Africa than men – and women are catching up to men when it comes to financing new motor vehicles.
An analysis of data by Lightstone this Women’s Month demonstrates the increasingly important role women are playing in South Africa’s economy.
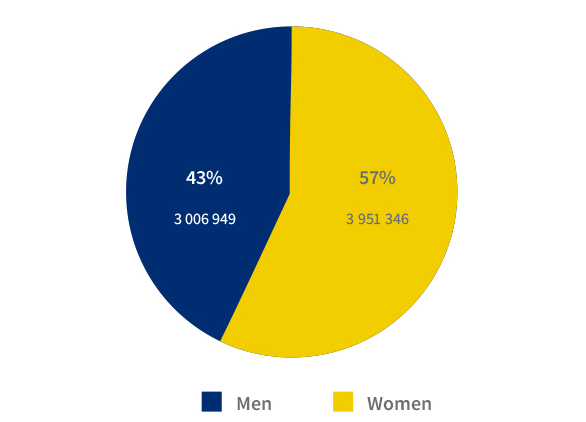
Women own 3.9m (57%) of South Africa’s nearly 7 million formally registered residential properties, either on their own or jointly with a man or another woman, as at July 2023 – and these properties account for 53% of the total value of the properties.
At the same time, women accounted for 45% of financed new vehicle sales in 2022, up from 41% in 2019, compared to 33% of financed used vehicle sales in 2022, up marginally on 32% in 2019.
More women than men own homes in South Africa
Most buy for R500k-R1m in their 30s and 40s – but the percentage of women transfers in 2022 fell slightly
Women own 3.9m (57%) of South Africa’s nearly 7 million formally registered residential properties, either on their own or jointly with a man or another woman, as at July 2023 – and these properties account for 53% of the total value of properties.
Residential stock volume July 2023: women vs men
Residential stock value July 2023: women vs men
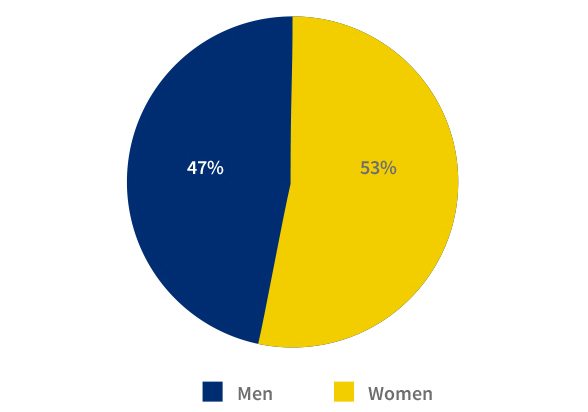
The total value of residential stock is R6.787 trillion, of which women owners, either on their own or jointly with men or women, account for 53%.
An analysis of data by Lightstone this Women’s Month demonstrates the increasingly important role women are playing in South Africa’s economy.
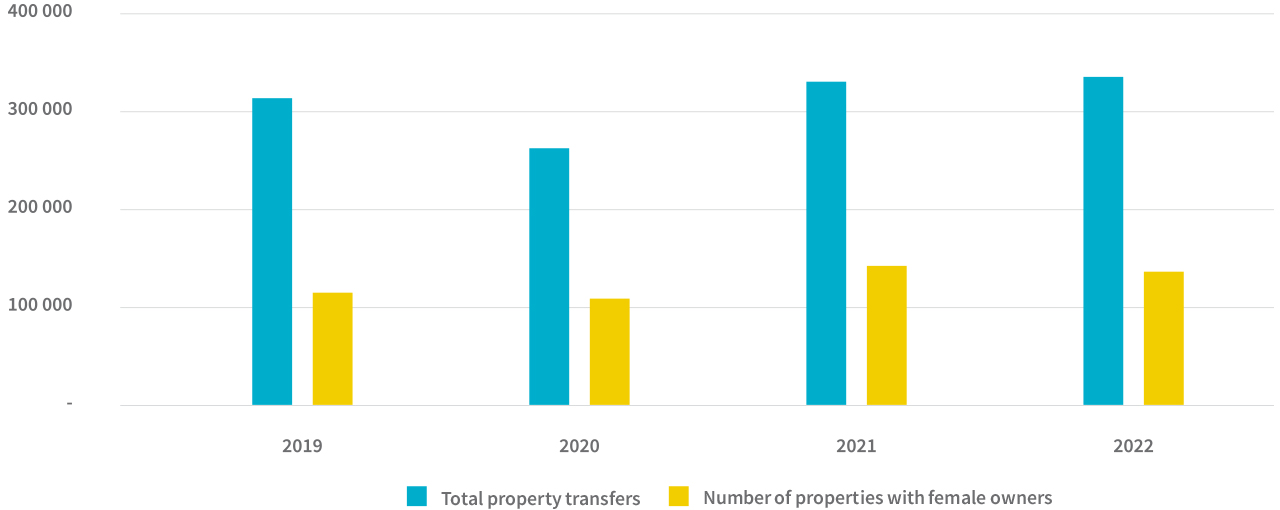
While the value of property transfers rose marginally from 2021 to 2022 (see graph below), the value of properties owned by women fell slightly. Similarly, in the graph which follows, the volume of transfers involving women also dipped slightly in 2022, although both value and volume numbers are above the pre-Covid data of 2019.
Value of property transfers: women as proportion of total transfers, 2019 - 2022
Volume of property transfers: women as proportion of total transfers, 2019 - 2022
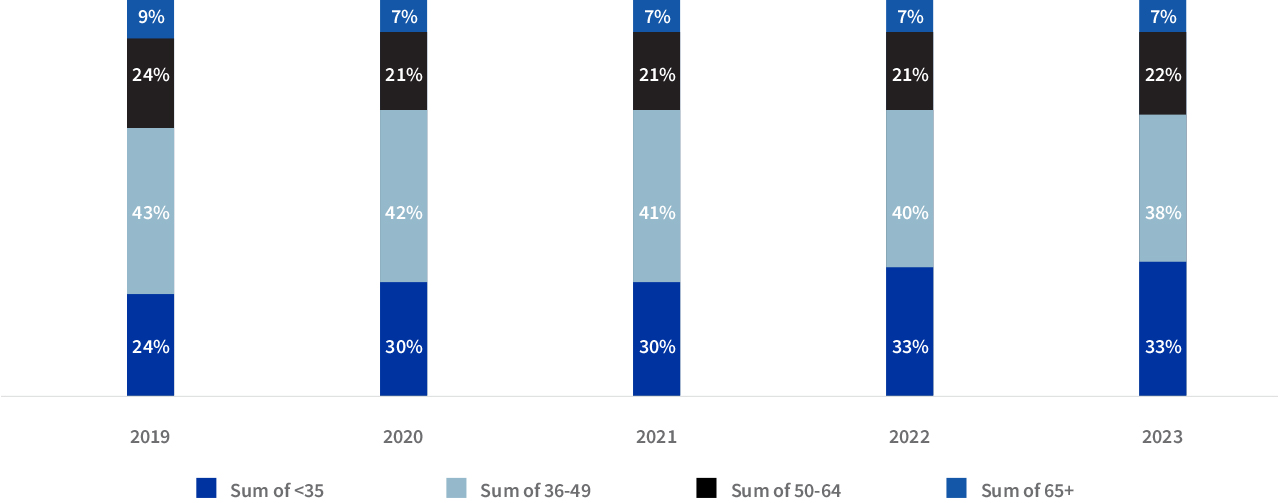
Most women buyers (see graph below) are aged between 36-49 (consistently around 40% over the past five years), and this correlates with the data in another story in this newsletter. In Celebrating women homeowners, courtesy of government subsidies, we see that homes are mostly allocated by government to women aged between 30-40. We are also seeing an increase in younger women buyers.
Age of women buyers
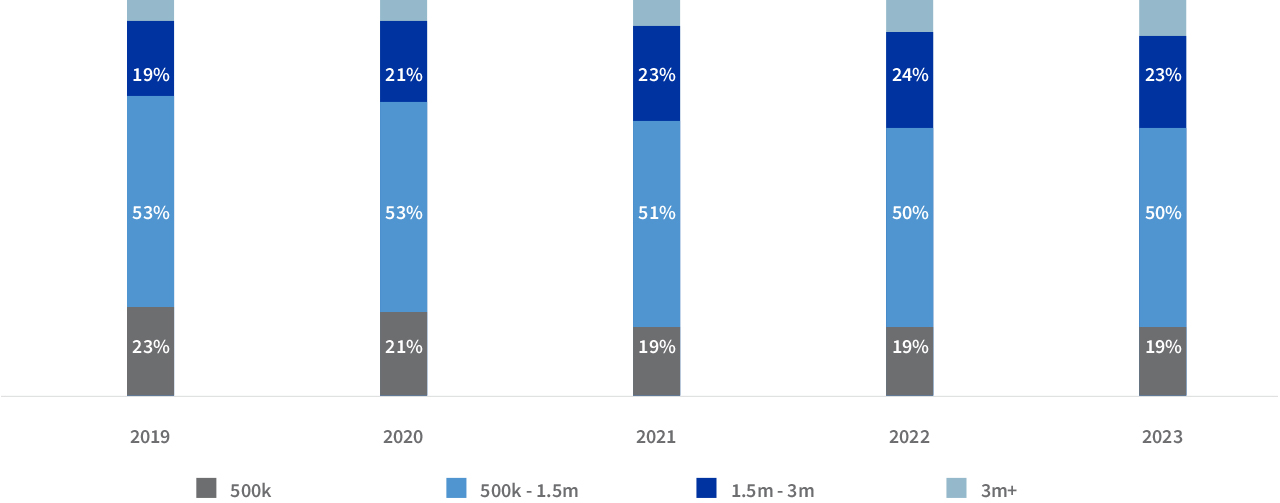
Around 50% of properties transferred to women are valued at between R500k-R1m, and in line with market trends, women buyers in the R1.5m-R3m band are increasing.
Value band of property transfers to women
When comparing men and women’s activity in the home loan market from 2022 to date, we see some interesting trends developing:
- Women are less likely to bond properties than men: 77% of purchases by women (alone or with other women) were bonded compared to 84% by men, either alone or with other men.
- Women are less likely to borrow than men: 12% of these men took out a second bond within this period, compared to 8% of women.
- The average primary bond value taken out by women was about 20% lower than that of men.
- Bonds to women have increased substantially from ten years ago. In 2022, men accounted for 50 000 of the bonds issued while women accounted for 43 000. This has now changed to 63 000 to men and 67 000 to women.
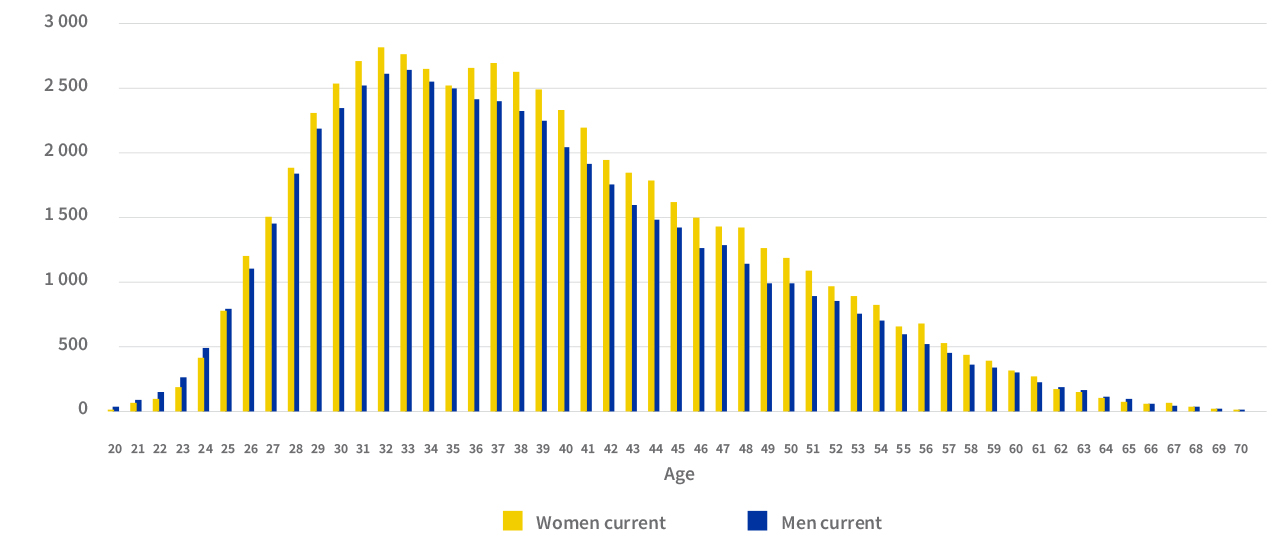
- Looking at primary bond activity according to age (graph below), we can see that from the age of 26 all the way through to 61 year olds, women take out more bonds than men, and they outstrip men particularly from the ages of 36 to 41.
Age of primary bond takers women vs men (excluding mixed gender couples)
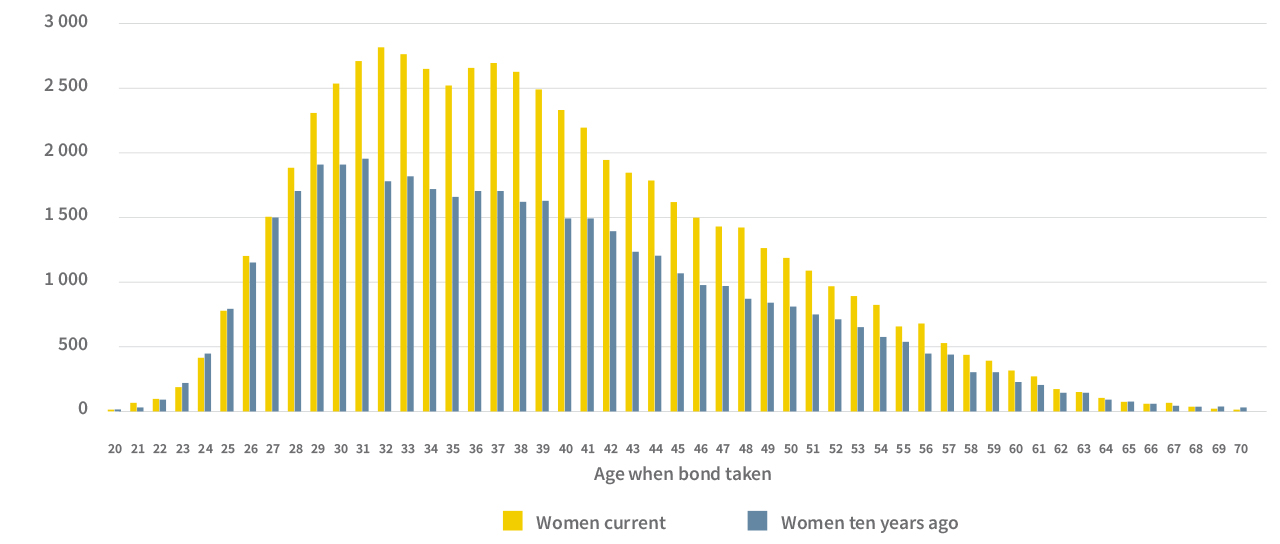
And if we compare women’s activity to that of ten years ago, they were most active in the similar age brackets.
Age of women primary bond takes current vs ten years ago (excluding mixed gender couples)
New trumps used for women vehicle buyers
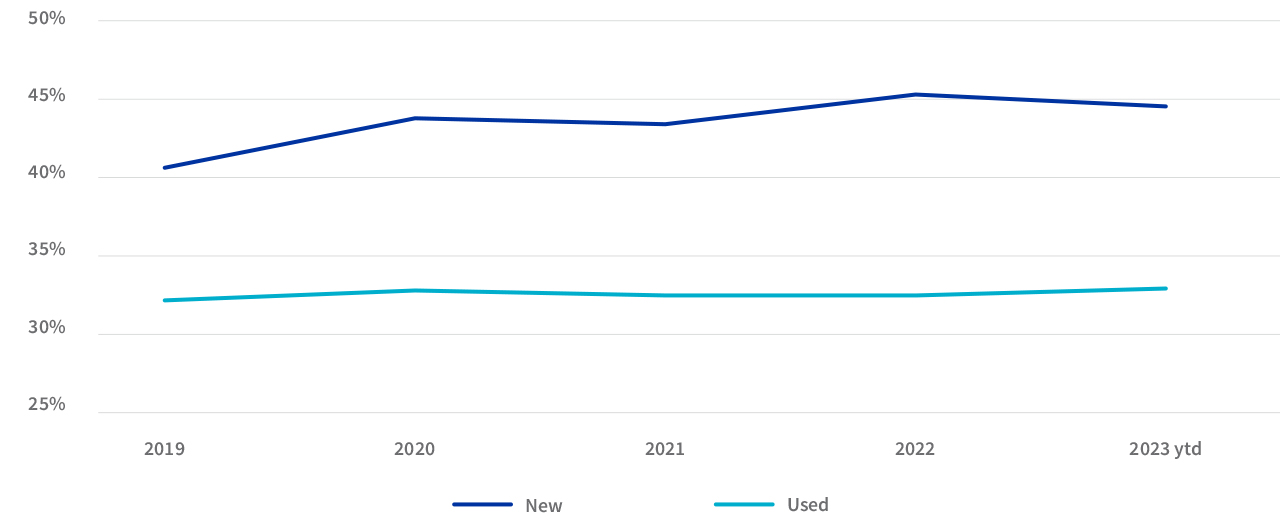
Women accounted for 45% of financed new vehicle sales in 2022, up from 41% in 2019, compared to 33% of financed used vehicle sales in 2022, up marginally on 32% in 2019.
The data says men are more likely to buy used vehicles, accounting for more than two thirds of sales, and new vehicle sales to men have also fallen over the five years, from 59% to 55%.
Women’s share of financed vehicle sales: new and used
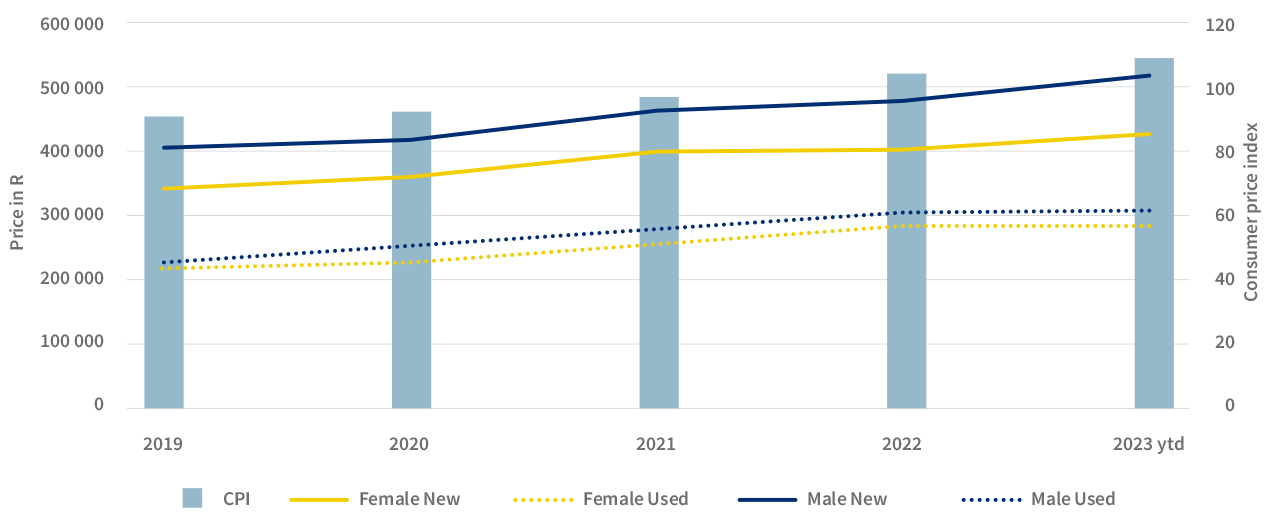
Women are paying less than men on average for financed new and used vehicles (see graph below), with the average price trending in line with the headline consumer price index.
Average price of vehicle: new vs used
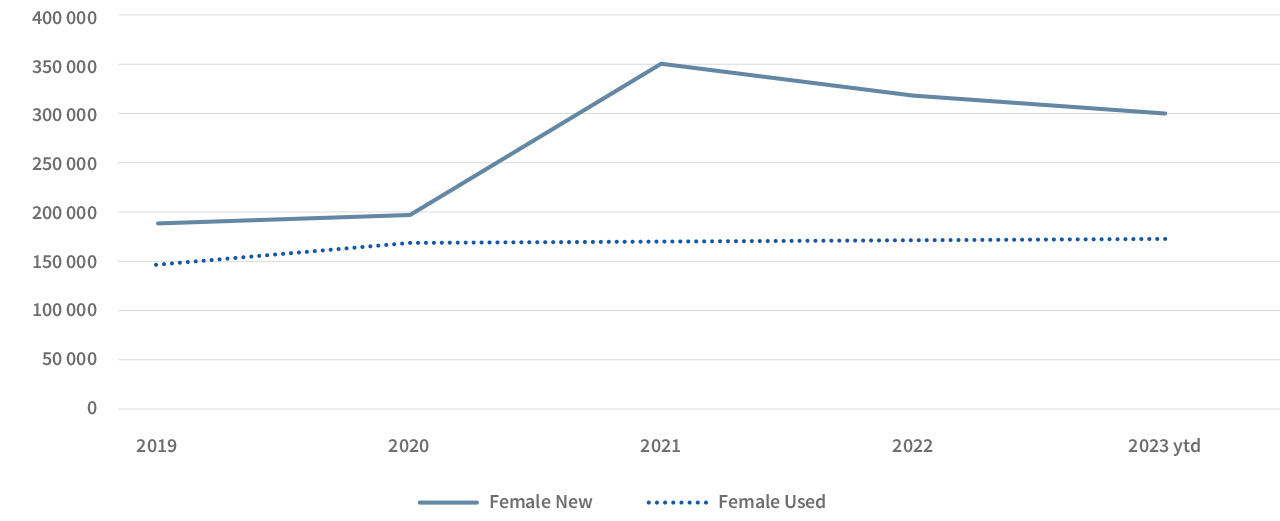
The most popular price paid by women for financed new vehicles jumped 75% to R350 000 in 2021 from R200 000 in 2020, and has fallen back to R300 000 in 2023.
Most popular vehicle price: new vs used
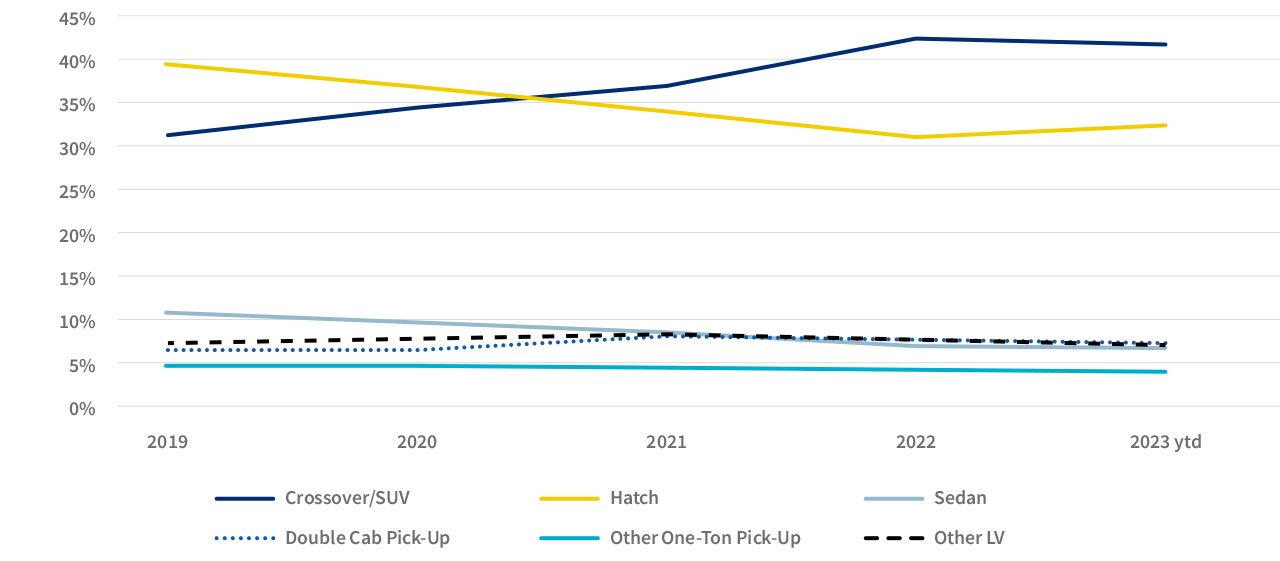
When it comes to vehicle body shape (graph below) for new and used sales, women are opting for Crossover/SUVs, just as men are. The Hatch has fallen from first spot in 2019 to second in 2021 at 34%, and falling a further 2% in 2022/23 behind the Crossover/SUV at 42% but well ahead of the Double Cab Pick-up in third place (8%), which has traded places with Sedans.
Women’s preference: vehicle bodyshape

.png)
.png)
.png)
.png)