Property Newsletter | April 2024
The not-so-affordable Affordable property market
South Africa’s tough economic conditions are mirrored in the country’s Affordable residential property, where value has risen over the past few years but volumes have dropped.
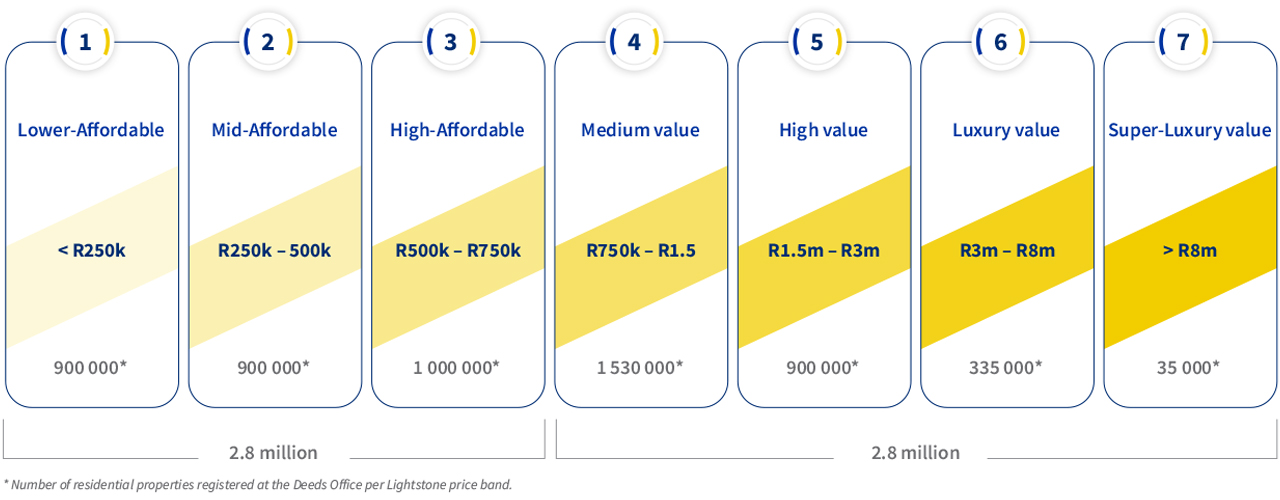
There are approximately 2.8 million formally registered “Affordable” residential properties in South Africa which accounts for half of the country’s 5.6 million registered properties Lightstone has estimated values for.
Formal property stock with estimated values

In addition to the 5.6 million registered properties, there are approximately 1.7 million properties Lightstone has not attached a value to (and many of these might be classified as Affordable).
A significant portion of this number is likely to be low-income housing which is not actively trading. The 5.6 million registered properties (see table below for Lightstone’s property bands for this segment of the market) exclude units in informal settlements and formal structures built on community trust land, such as the Ngomyana Trust.
What is “Affordable” property? And who can afford to buy?
Lightstone defines Affordable property as under R750 000 in value, and sub-divides the Affordable price band into three sub-bands: Lower Affordable (values under R250k), Mid Affordable (R250K-R500k) and Upper Affordable (R500k-R750k).
In order to afford servicing a R250k bond one needs a gross salary of R9k, for a R500k bond it is R18k and R27k for a R750k bond. We estimate there are around 6 million households in South Africa within these income ranges, providing further evidence of the upside potential to meet demand with supply.
Lightstone’s property bands – Affordable to Super Luxury

State of the market
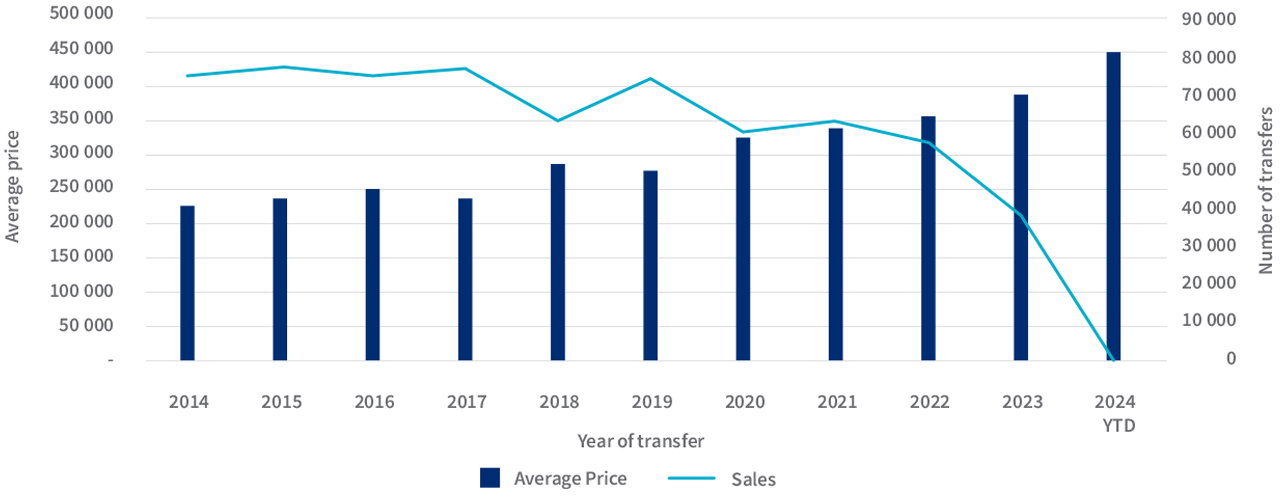
The average price paid for properties in the Affordable price band has risen over the past 10 years, from R230 000 in 2014 to R390 000 in 2023.
Average purchase price and transfer volumes: 2014 – 2023

Transfer volumes have fallen from 78 000 in 2014 to 38 000 in 2023, a more significant decline than that seen in the rest of the market. While the market overall has declined, the data suggests lower earners are under increasing financial pressure and are participating less actively in the property market.
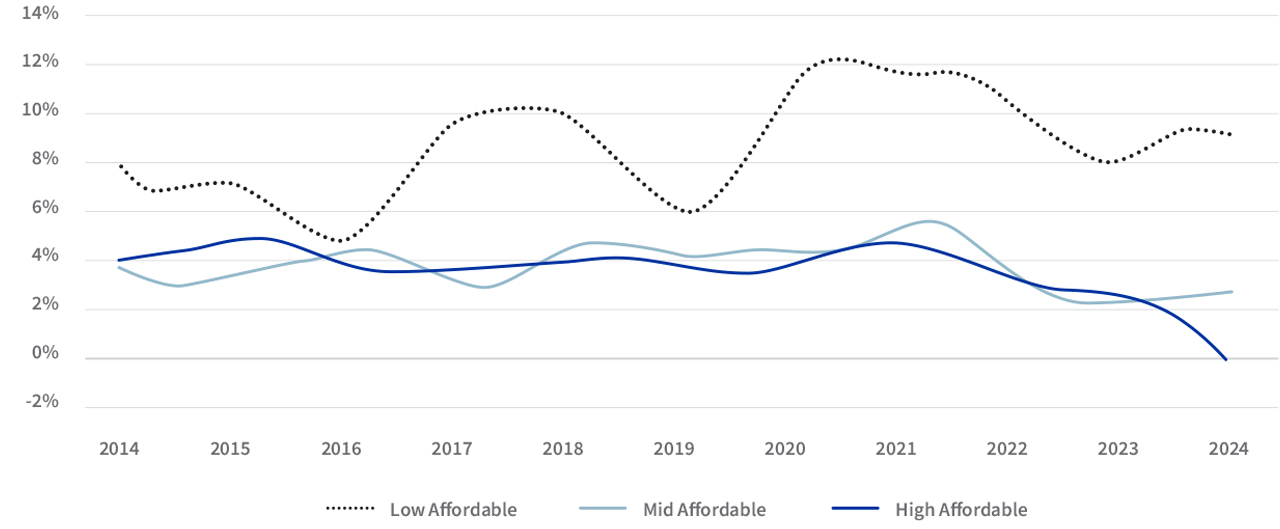
When it comes to value growth though the Affordable sector is doing well, particularly in the Low Affordable sub band, where growth each year has mostly been above 8%.
Affordable price sub bands: annual growth 2014 – 2023

Sales in 2023

Sales data in 2023 highlights that nearly 50 000 transfers took place in the Affordable market, which accounted for a third of all sales. However, as the Affordable market constitutes 50% of registered properties, it does indicate a lower rate of activity in the segment (25% sales from 50% of the market).
Township sales accounted for just 10 000 transfers. Sectional Title accounted for 30% of sales and Freehold 70%.
Where can you buy Affordable properties?
Just more than half (52%) of the 2.8m properties considered as the formal Affordable market are situated in traditional townships, but the activity ratio for sales as a proportion of stock is highest in the suburbs, and especially in the Sectional Title category.
Affordable property categories
There are 1.1 million (75%) Freehold properties in the suburbs, and 300 000 (25%) Sectional Title properties. Almost all Affordable properties in townships are Freehold.
Aging Affordable stock
There are about 3 000 developments (Sectional Title or Estates) which contain more than 30 Affordable units, totalling around 200k living units. The rest of the market is made up of houses in townships or suburbs, with an average value of R520k.
However, many of these developments are aging and have, over the years, declined in relative value, in areas like Durban and Sunnyside.
A small proportion of the Affordable developments are new developments, with only 10% developed in the last five years, 10% in the previous five years and 80% more than 10 years ago.
The age distribution of all Affordable properties (not only those in Sectional Schemes and developments) can be seen in the graph below, and it demonstrates that there has been little investment, relatively speaking, in recent years in this category.
Age of Affordable properties

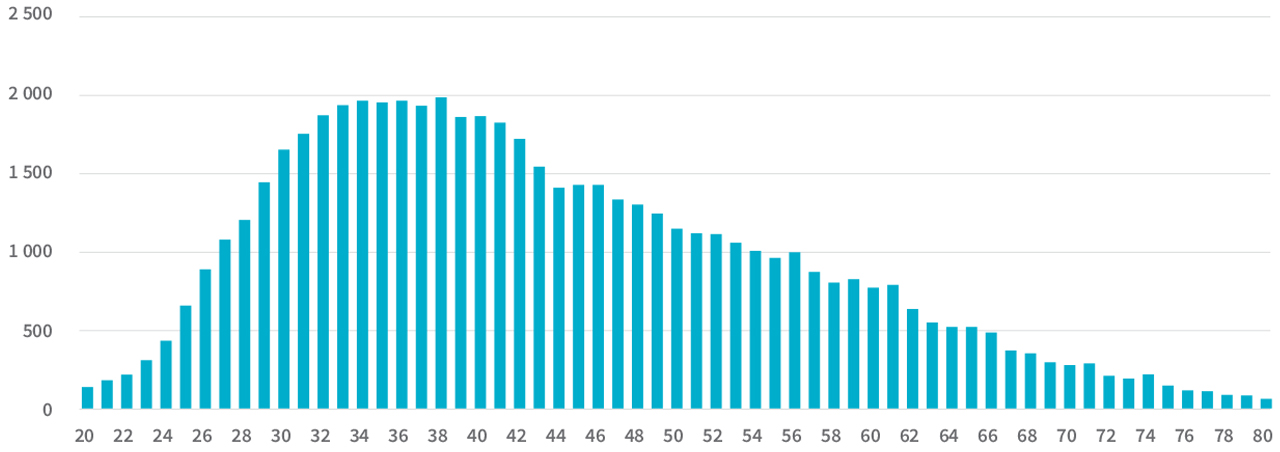
There are developers aiming to address this, giving the start-up youth access to attractive and affordable housing and not limiting them to old neglected stock. This is important as the graph below demonstrates that people under 30 make up a relatively small share of the market.
Age distribution of 2023 buyers of under R750k properties


.png)
.png)
.png)
.png)