Property Newsletter | June 2024
SA property stock doubles in 30 years of democracy
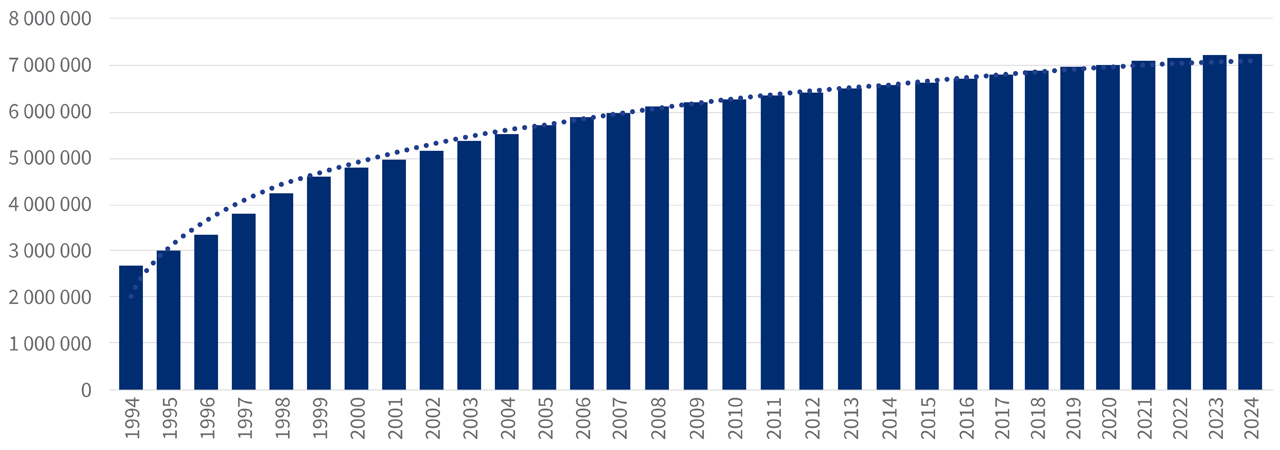
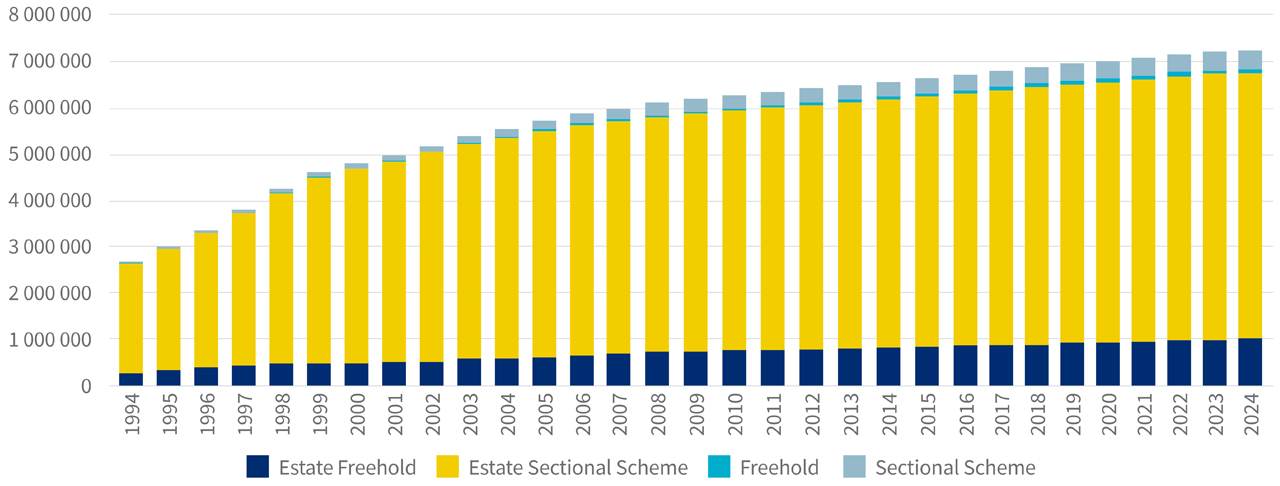
Residential property stock registered at the Deeds Office has more than doubled in South Africa’s first 30 years of democracy, rising from 2.7m in 1994 to 7.2m this year.
Residential stock: 1994 - 2024
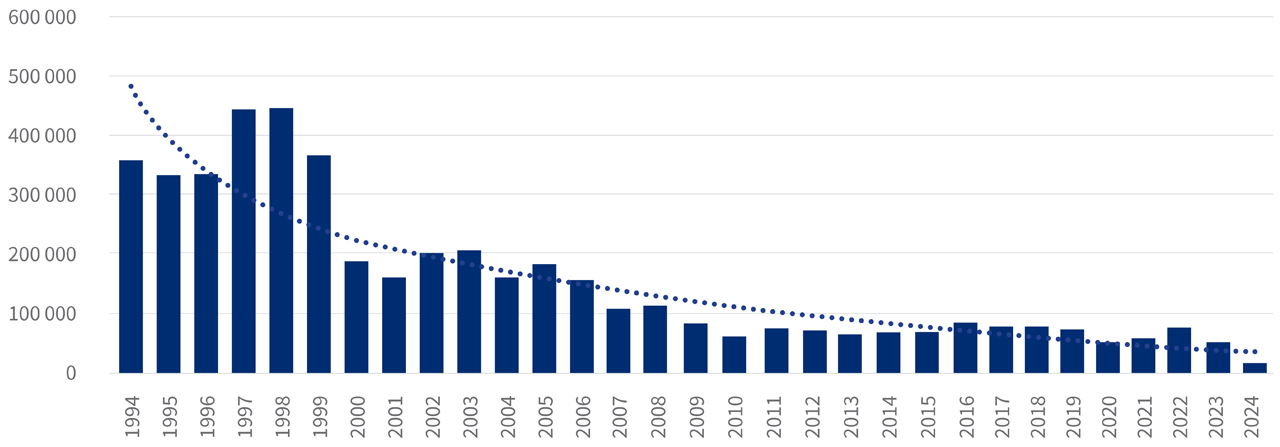
Data from the Deeds Office tells us much of the new residential stock added between 1994 and 1998 is RDP/subsidised housing. The low development mark was 334 000 in 1994 with a high of nearly 447 000 in 1998. A second phase between 1999 and 2005 recorded a high of nearly 209 000 in 2003 and a low of 165 000 the following year. In 2007 new residential stock numbers dropped to 112 000 before reaching a 30-year low of just under 55 000 in 2020. In this third phase, new residential stock has not risen above 87 000 units.
New residential stock added: 1994 - 2024
While the overall stock count has risen, sales volumes have been plateauing in recent years and in 2023 drifted close to 208 000, not much higher than 1994’s 190 000. The property market reached a high point in 2006 and 2007, with more than 320 000 sales recorded in both years, before falling in 2008 to 231 000 and then dropping to just under 155 000 as the 2007/8 global financial markets crash took their toll. The market recovered to nearly 238 000 sales in 2016 before drifting downwards to 197 000 in 2020 as Covid took its toll. A strong reaction in 2021 and 2022 gave way in 2023, when just more than 207 000 sales were recorded – not much higher than 190 000 in 1994.
Residential property sales: 1994 - 2024
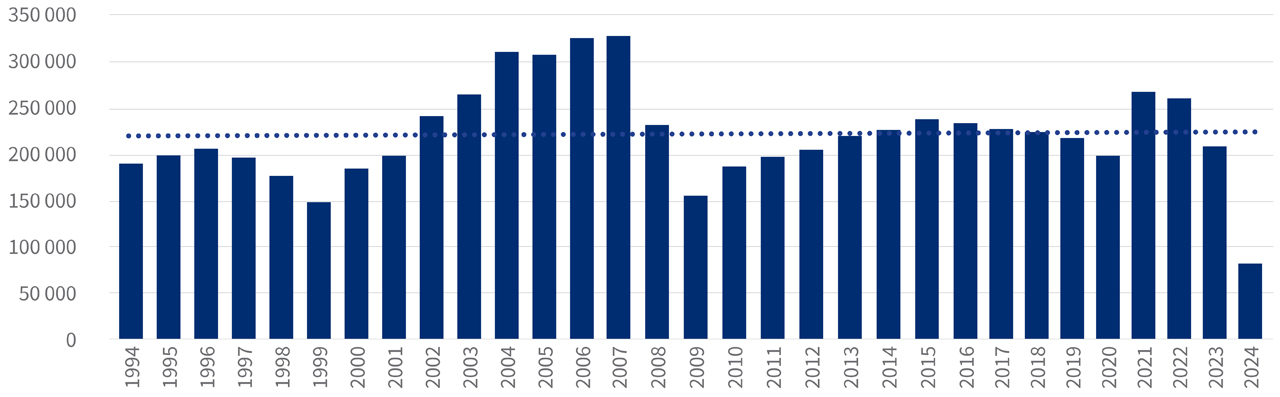 Sales limited to >R30 000; single property sales only; full property only, not part sales of jointly held properties
 Nominal sales prices have, however, been steadily rising, from just under R150 000 in 1994 to R1.4m in 2023.
Residential property average sales price: 1994 - 2024
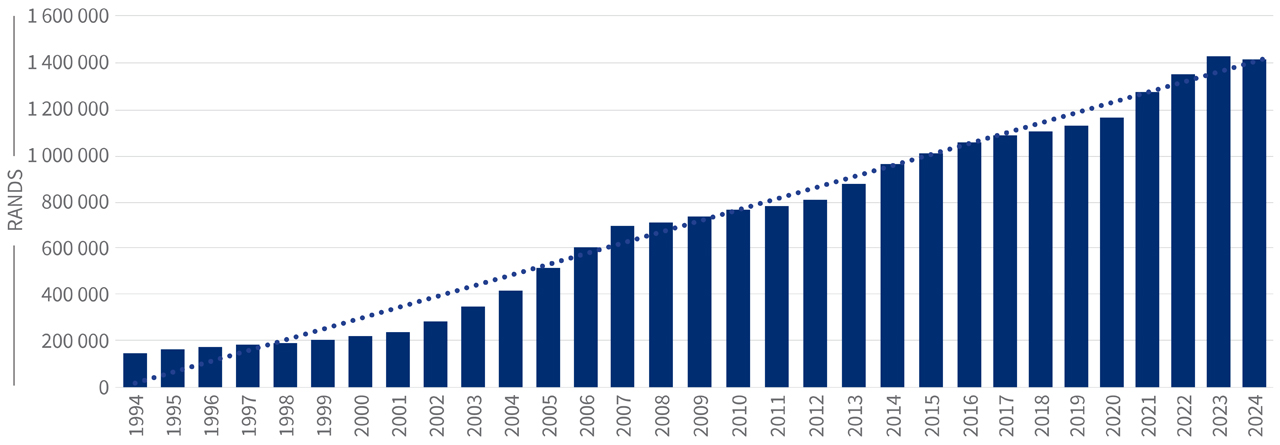 Sales limited to >R30 000; single property sales only; full property only, not part sales of jointly held properties
 Changing face of the market
Freehold remains the dominant property type, but the market is changing with Sectional Schemes and both Freehold and Sectional Schemes within Estates growing their share of the market.
Residential stock/categories: 1994 - 2024
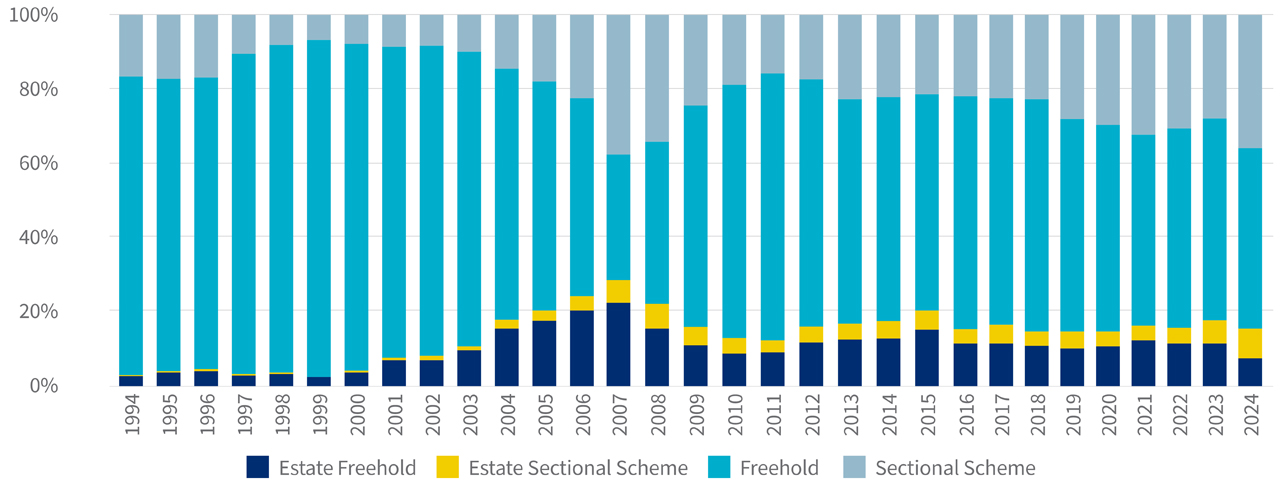
If we look at new stock added per property type (graph below), we can see how the shift is gathering momentum in favour of Estates and Sectional Schemes.
New stock/property types: 1994 - 2024
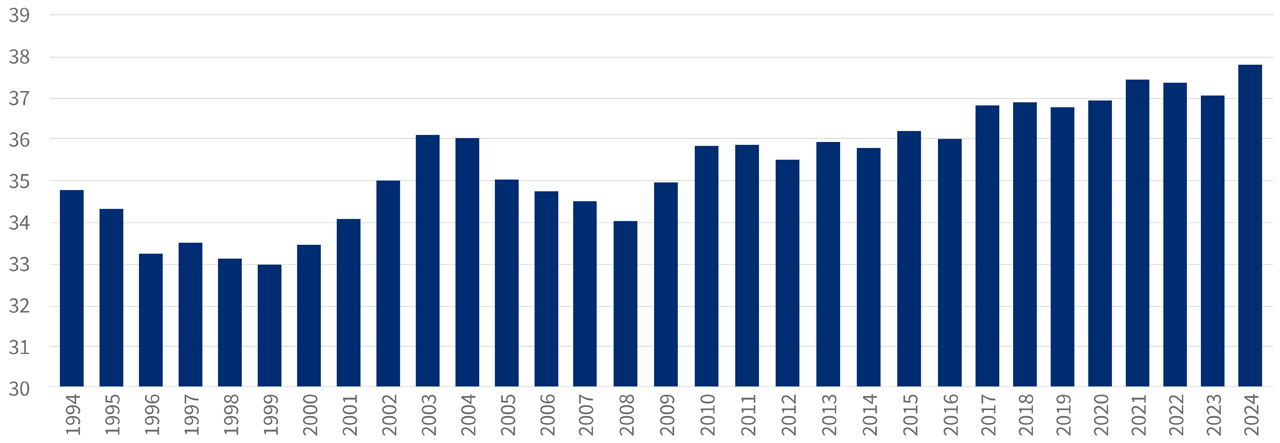
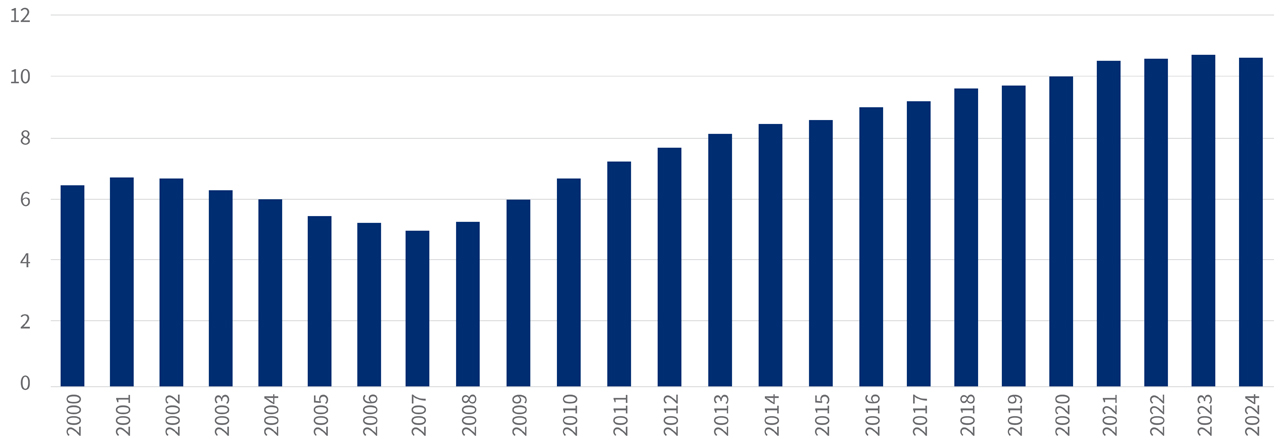
Other market changes are the age of buyers and tenure of occupation before selling, and we can see how the financial markets crash of 2007/8 impacted behaviour. Buyers have got older, and tenure has been extended (see the following two graphs).
Average age of buyers: 1994 - 2024
Average tenure of sellers: 2000 - 2024
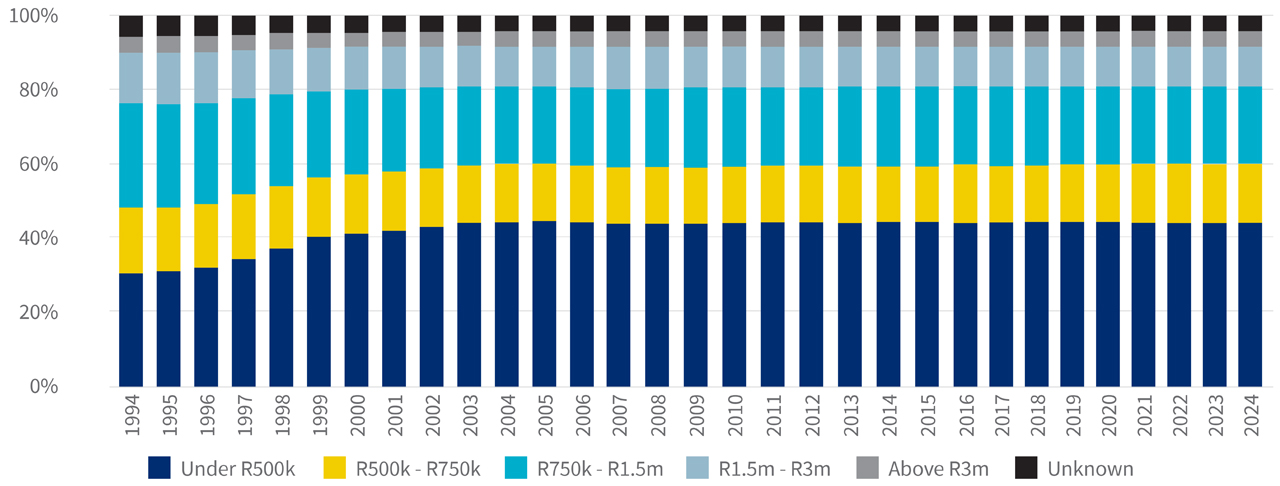
Value bands
When we look at the value bands (using the property’s current calculated value to categorise it in value bands), we can see how the mix of value in stock changed over the years.
The proportion of houses valued at less than R500 000 grew from 1994 to around 2005, and it has remained reasonably constant since then. Conversely, houses in the R750 000 to R1.5m band have fallen as a percentage of the total.
Total stock per value band in today’s prices
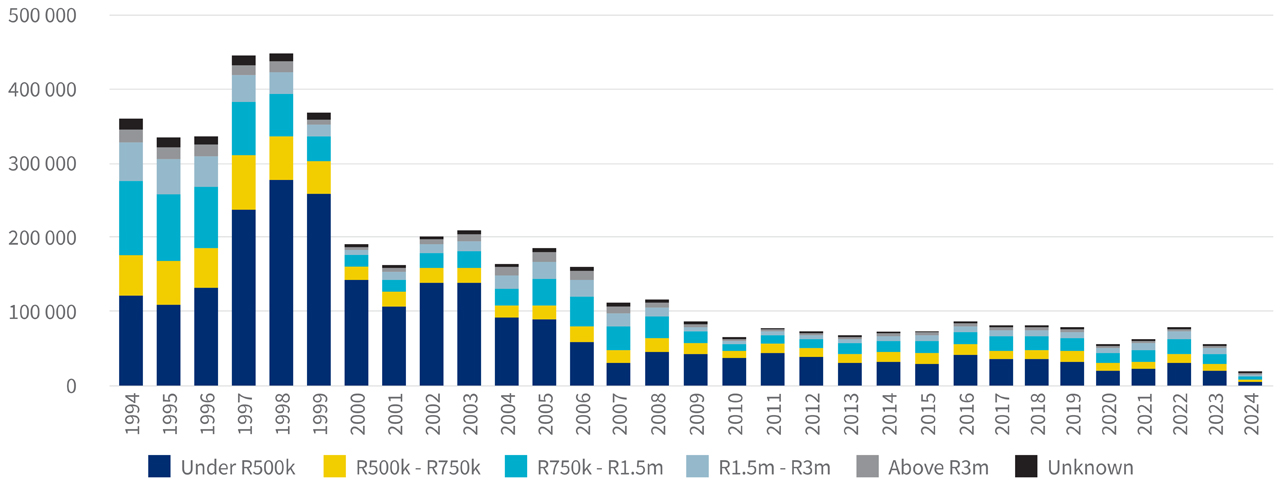
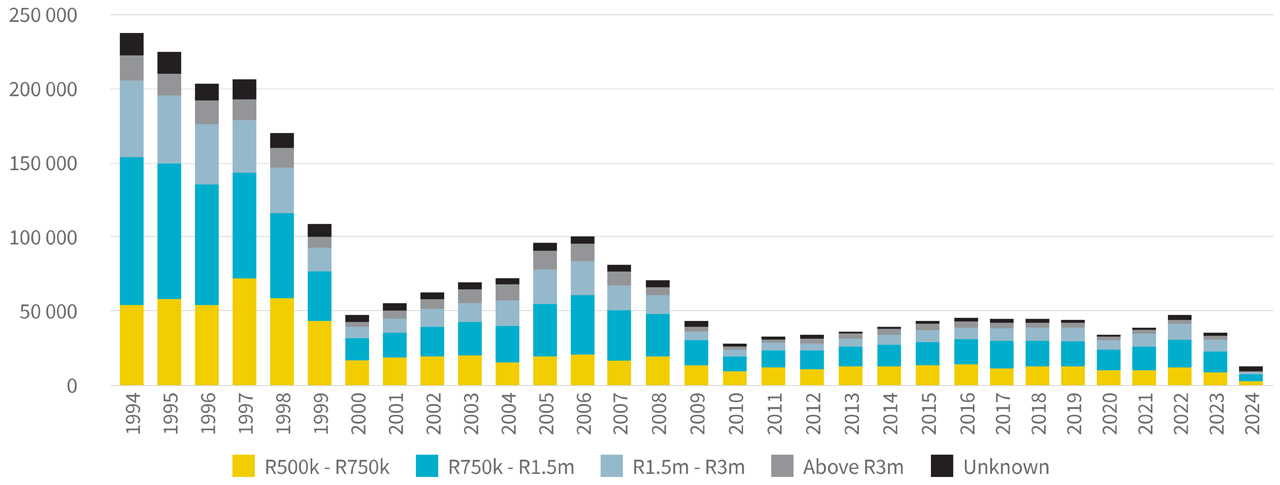
There was a step change in the 1990s most likely the result of RDP/BNG/subsidy housing coming onto the market. If properties under R500 000 are stripped out, the balance of value band development alters (see the two graphs below).
Value bands of stock added: 1994 - 2024
Value bands of stock added above R500k: 1994 - 2024
.png)
.png)
.png)
.png)