Property Newsletter | February 2022
Residential market bouncing back after covid blues
Overall trend still negative, but upper middle to luxury bands more resilient
South Africa’s residential property market bounced back in 2021 from the Covid-induced low in 2020 – but all eyes will be on whether the market continues to improve and grow or revert back to its gentle, downward trajectory of the last fi ve years.
Property transfers totalled 318 152 in 2021 as pent-up demand from 2020 – when hard lockdowns severely impacted the market – came through the system. However, the average of 2020 and 2021 would still have represented a decline from 2019, which itself was signifi cantly down on 2018’s 326 035.
Number of transactions in South Africa
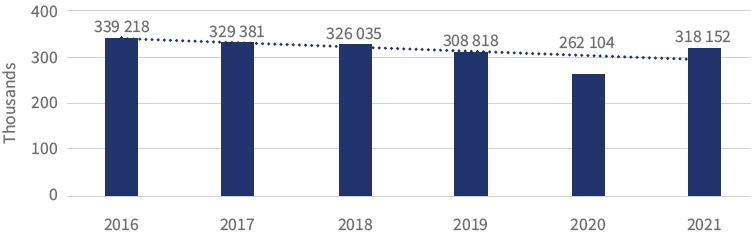
Tough economic conditions and political and economic policy uncertainty continue to undermine confi dence in many spheres of activity, including the residential property market.
Until the macro environment improves, it seems unlikely the property market will either, although there have been pockets of resilience and growth in certain geographical areas and price bands.
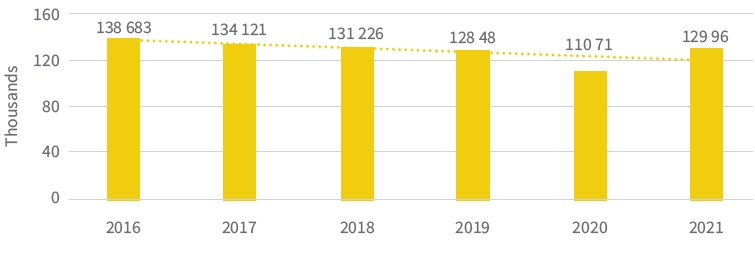
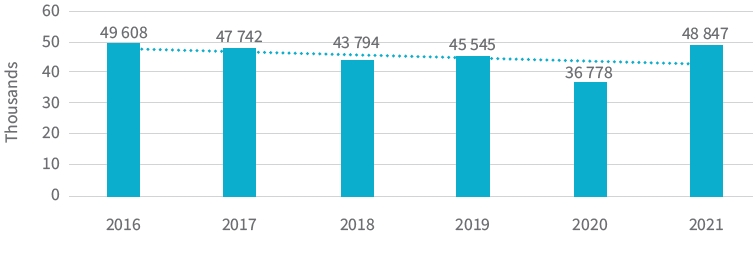
Gauteng (see graph below) remains the province with the most property activity, with 129 960 transactions in 2021, just short of the total number recorded in 2018.
Number of transactions in Gauteng
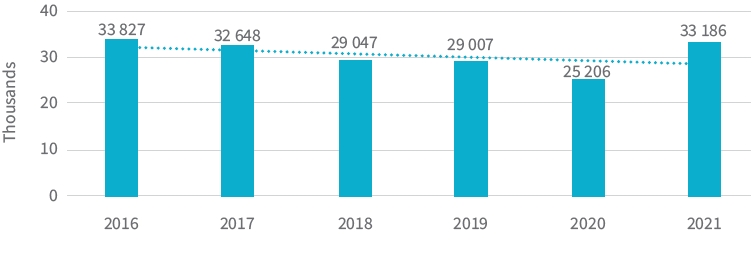
Number of transactions in Western Cape
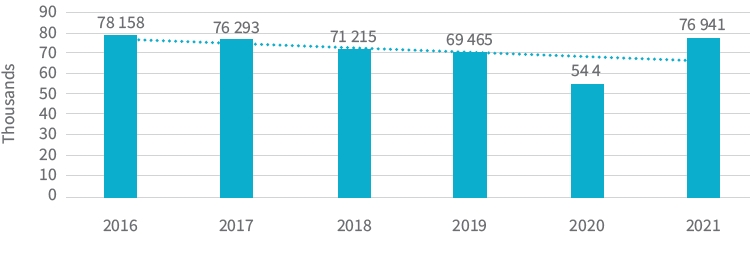
The Western Cape was next highest, with 76 941 transfers registered in 2021, signifi cantly up on the 54 400 transfers in 2020 and the best year since 2016. In fact, 2021 reversed four years of decline, and a combination of low interest rates, better run municipalities and work-from-home / semigration would more than likely account for the change.
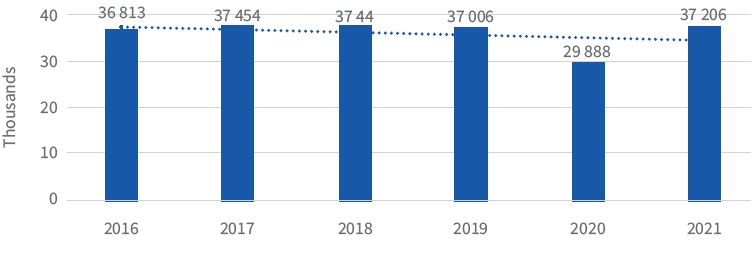
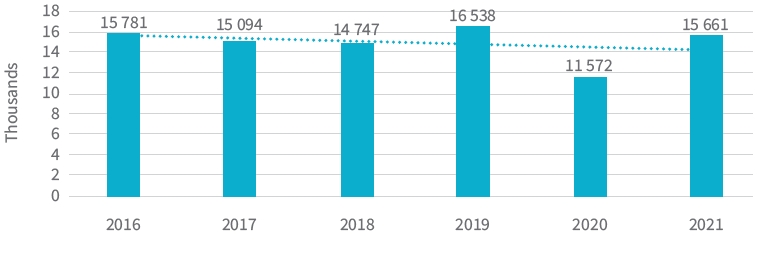
Transfers were also up in KwaZulu-Natal in 2021 but remain just below 2018 levels.
Number of transactions in KwaZulu-Natal
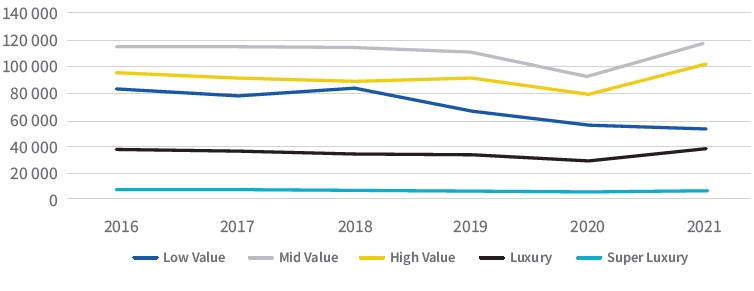
Growth in High Value and upwards
So, while the residential property trend is negative, there are pockets where recoveries have been stronger and performance has been good.
| 2016 | 2017 | 2018 | 2019 | 2020 | 2021 | |
|---|---|---|---|---|---|---|
| Low Value | 82 985 | 79 317 | 82 466 | 67 787 | 55 498 | 53 384 |
| Mid Value | 115 210 | 115 436 | 112 888 | 111 888 | 111 164 | 117 159 |
| High Value | 95 579 | 92 087 | 89 621 | 90 093 | 79 551 | 102 462 |
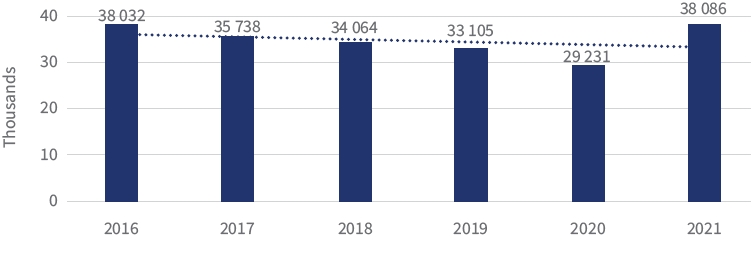
| Luxury | 38 032 | 35 783 | 34 064 | 33 105 | 29 231 | 38 086 |
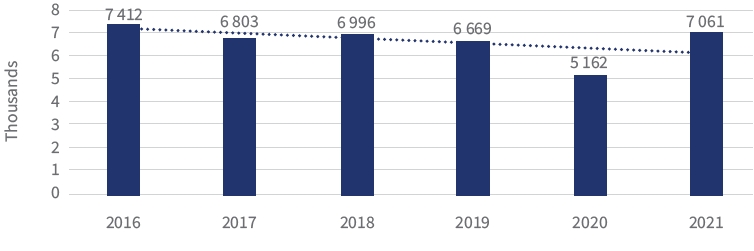
| Super Luxury | 7 412 | 6 803 | 6 996 | 6 669 | 5 162 | 7 061 |
| Total | 339 218 | 329 381 | 326 035 | 308 818 | 262 104 | 318 152 |
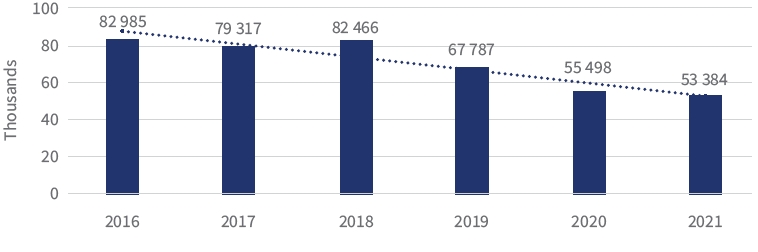
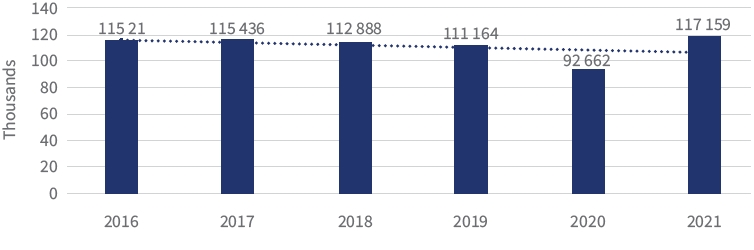
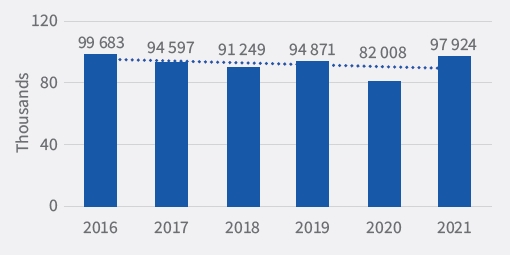
This, unfortunately, is not true of the Low Value market which has declined signifi cantly in recent years. In 2021, 53 384 transfers were registered as compared to a six year high of 82 985 in 2016. The Mid-Level market has, however, recovered to just above 2016 levels, although as the graph below shows, the performance across all fi ve bands is poor to pedestrian, with just the High-Level band performing positively.
Property bands and transfers
Lightstone’s Wealth Segments
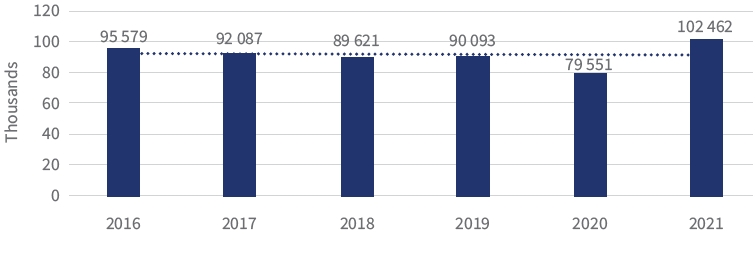
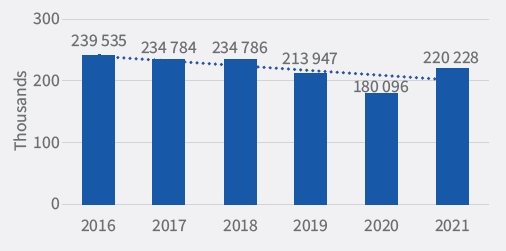
In fact, High Level transactions in 2021 were at a six year high, as was Luxury by a few transactions and Super Luxury was not much short of its high in 2016. The data confi rms that it is the middle class and wealthier homeowners who are better weathering the economic storms.
Number of Low Value transactions in South Africa
Number of Mid Value transactions in South Africa
Number of High Value transactions in South Africa
Number of Luxury transactions in South Africa
Number of Super Luxury transactions in South Africa
Sectional Scheme transactions slightly up as a %
Sectional scheme transfers account for 30.7% of all transfers in 2021, nearly 1.5% more than the 29.3% in 2016.
Number of Freehold transactions in South Africa
Number of Sectional Scheme transactions in South Africa
As you were! 2021 bounce numbers mirror 2016 in Cape Town
While the total transactions, Freehold and Sectional Scheme numbers recorded in Cape Town in 2021 were similar to those recorded in 2016, they do not yet reverse the declining trend. The Western Cape has been the benefi ciary of semigration but not to the extent yet that it is infl uencing the numbers upwards.
Number of transactions in Cape Town
Number of Freehold transactions in Cape Town
Number of Sectional Scheme transactions in Cape Town

Solutions that simplify the complex
Our new website makes it easier to navigate and discover a range of Lightstone products and solutions that make it easier for you to do business.

One place to access your subscriptions
We’ve simplified the complex with a single sign on functionality. Simply login and you will have access to all the products that you currently subscribe to. All in one portal.

What’s happening to the old website?
A few links on our new website may redirect you to certain pages on the old website. This is just a temporary solution to ensure legacy users still have access to certain products.
.png)
.png)
.png)
.png)