Property Newsletter | October 2021
A buyer’s market
Semigration, buying upwards and safe living dominate market as first-time buyers appear to lose their appetite.
Predicting where residential property will go in the next twelve to 24 months is hazardous given all the complicating circumstances.
Interest rates and economic growth are two fundamental drivers of residential property sales, while a third – socio-political developments – has become increasingly important in South Africa.
All these drivers have been overshadowed in the past 20 months by Covid-19. It has resulted in low interest rates as government seeks to combat the negative eff ects of the pandemic and lockdowns on an already moribund economy.
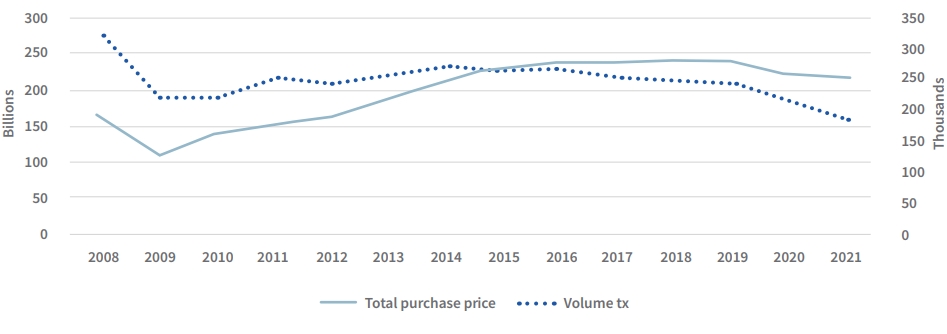
Residential property is edging towards pre-lockdown levels, although as our graph below demonstrates, transaction volumes are still nearly 25% down on those recorded in 2008.
Transaction value and volume 2008-2021 Q3
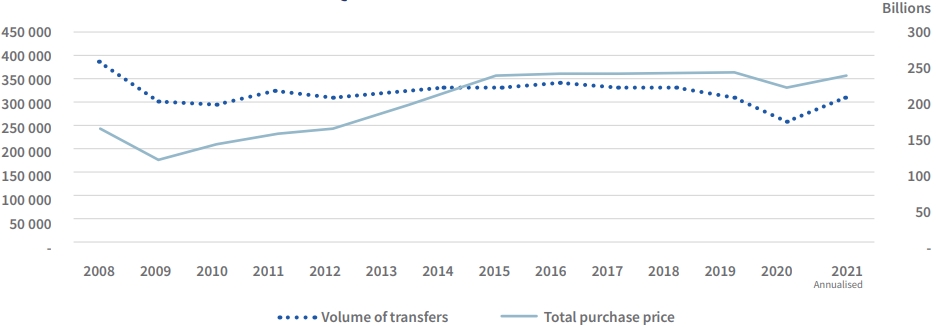
In assessing where the market will go, it’s useful to understand how the three drivers will play out, the current state of play, and where the signifi cant potential sits to push volumes back to 2008 levels.
Economic growth
Reuters reported in September that South Africa’s economy grew 1.2% in the second quarter against a forecast of 0.7%, a better-than-expected outcome driven by sectors like communications, agriculture and mining. The graph below provides a 25-year view of GDP growth in SA, with the contraction in 2008/9 and then 2019/2020.
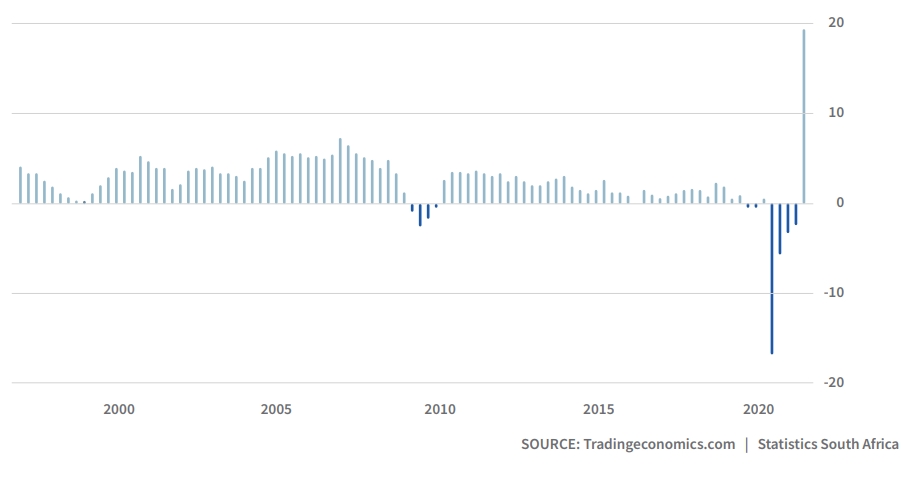
The weakened economic conditions are mirrored by South Africa’s worsening unemployment rate which hit 34.4% in July 2021.
Rising unemployment coupled with pedestrian GDP growth suggest the economy will continue to underperform – as the next graph on projected GDP growth suggests.
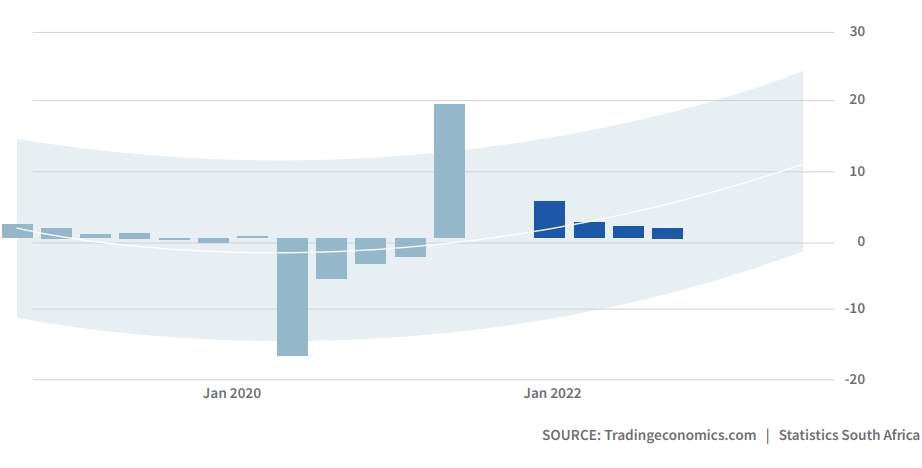
Reuters said that while GDP jumped 19.3% in the second quarter, it refl ected “a low base last year when the government shuttered much of the economy during a harsh lockdown to contain the spread of the coronavirus.” Furthermore, the National Treasury has estimated the July riots could cut as much as 0.9 percentage points from this year’s economic growth fi gure.
Volumes and GDP
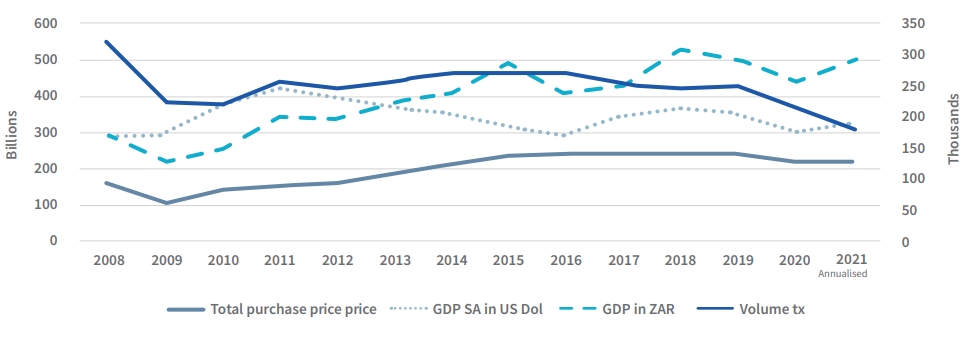
The graph above attempts to show the performance of the property market against the performance of the economy measured by GDP. (The ZAR GDP numbers are too big (trillion versus billion) to fi t the chart, so have been normalised by dividing /10 – showing GDP development but not on scale.) The better measure is the SA GDP expressed in dollars. Clearly unemployment, political uncertainty and uncertainty around Covid-19, amongst many factors, also impact the property market.
Interest rates
Despite the poor economic circumstances, many commentators believe the momentum in the property market will continue for at least the next 12 to 24 months, fuelled by the low repo rate which the Reserve Bank said recently would remain unchanged at 3.5%, helped by a friendly infl ation rate.
However, economists caution that they expect the repo rate to begin rising in 2022, and this will make purchasing property more expensive – and may expose those buyers already in the market who simply cannot aff ord higher interest rates.
Socio-political factors
Declining service delivery by many municipalities has been nudging professionals and others who can work remotely towards coastal or semi-rural living, and Covid-19 has accelerated this trend.
Just what impact, if any, the recent riots in KZN will have on the residential market is yet to be determined.
Covid-19 remains a wild-card, and the anticipated fourth wave in December-March will be signifi cant, but particularly if it heralds further economically damaging lockdowns. If it is easier than previous waves, then SA may quicken its return to “normality”.
Where are we now?
The 2021 market has benefitted from pent-up demand from the initial hard lockdown phases, but will this momentum be carried into 2022?
The low interest rate has been particularly positive for the market, with nominal price growth up around 4% in February 2021 compared to February 2020.
Growth is coming from specific segments of the market as our next section reveals. While overall volumes have declined, the total purchase price paid has increased (see graph below).
Transfers: total purchase price and volumes
Transfer volume by property type
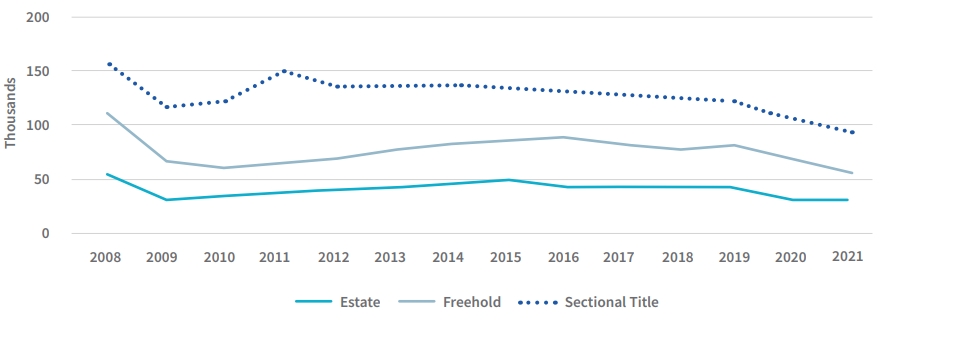
In the graph above, we see that all residential categories – Freehold, Sectional Title and Estates – are slipping down. The tables below look at recent years and the movement within provinces.
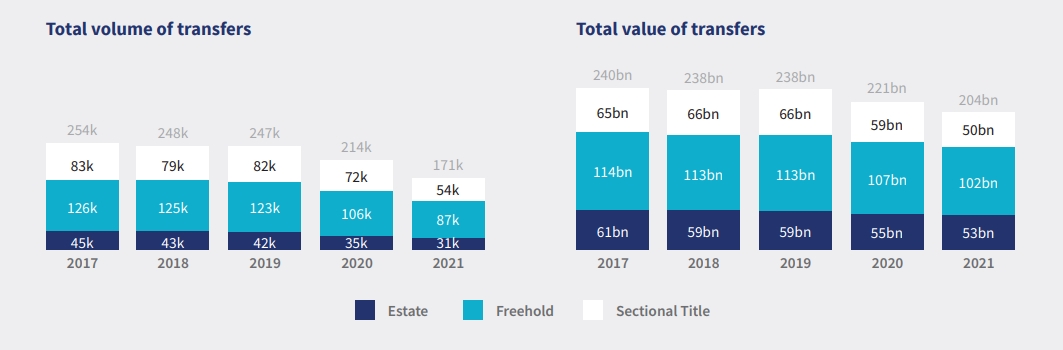
Property transfers: volume and value
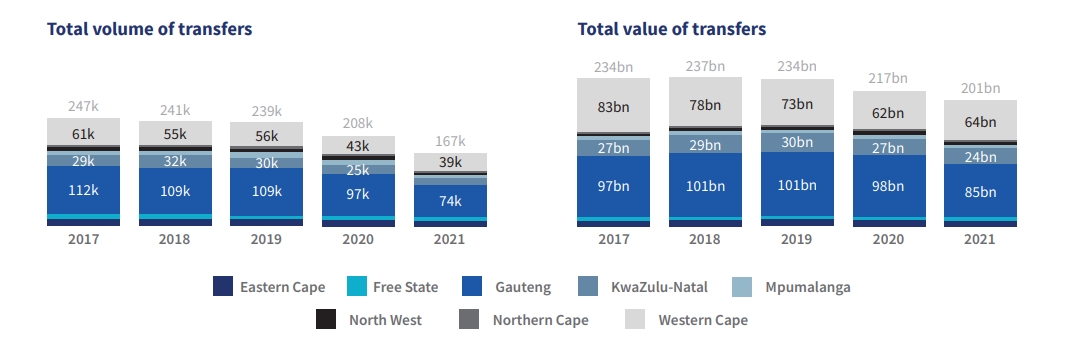
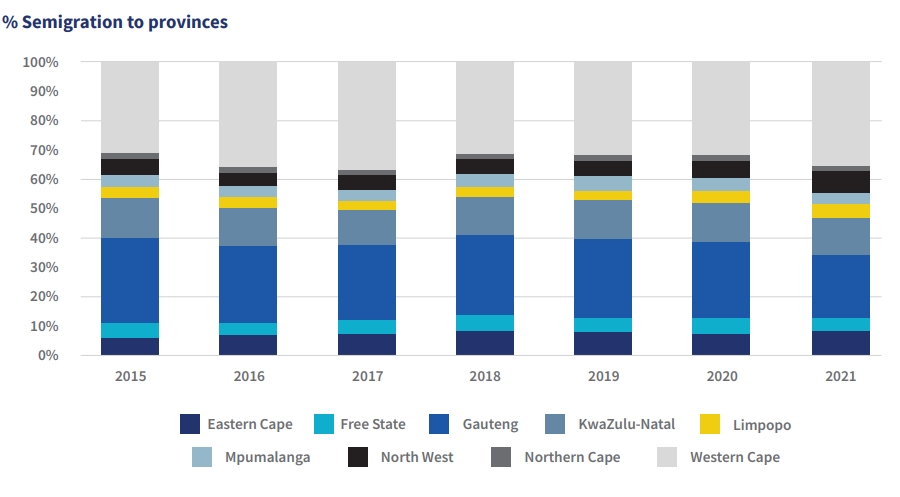
Property transfers: provincial volume and value
Property transfers: municipal volume and value
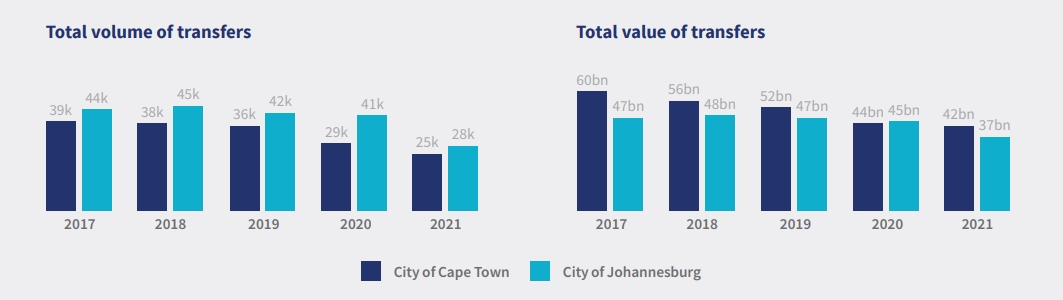
Interestingly, while the graph above tells us that Johannesburg accounts for more sales than Cape Town, the value of the sales in Cape Town is higher.
Where will the market go?
Critically, will the economy get the kick-start it needs, and what will happen to interest rates? And, what of socio-political conditions?
Assuming Covid-19 comes under control over the next 12 months and SA sees the end of lockdown restrictions, the economy should gather some momentum on its own.
There are economists who see the repo rate moving upwards in 2022/2023, and this will negatively impact house prices in the medium term, particularly if economic growth is not there and if socio-political conditions don’t ease.
Bigger homes to work from as semigration trend gathers pace
Work-from-home lifestyle is continuing to infl uence property sales, especially in remote and coastal areas, where buyers are looking for larger, better equipped homes which serve a dual purpose.
Among the country’s major municipalities, Lightstone’s data shows that coastal municipalities perform better than inland municipalities. This can be partly attributed to an ongoing trend towards semigration or buying of second homes, with a growing number of people from Gauteng looking to move to the coast.
Buying up should continue
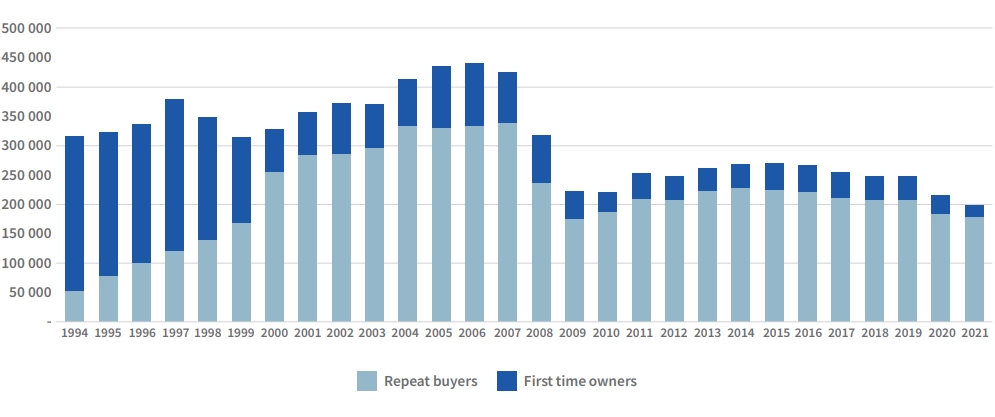
While entry level buying and first-time buying appears to be cooling, a second surge is evident with the rate at which high value purchases and second-time buying has increased.
Volume of first time and repeat buyers
Gated communities – housing estates, sectional title developments
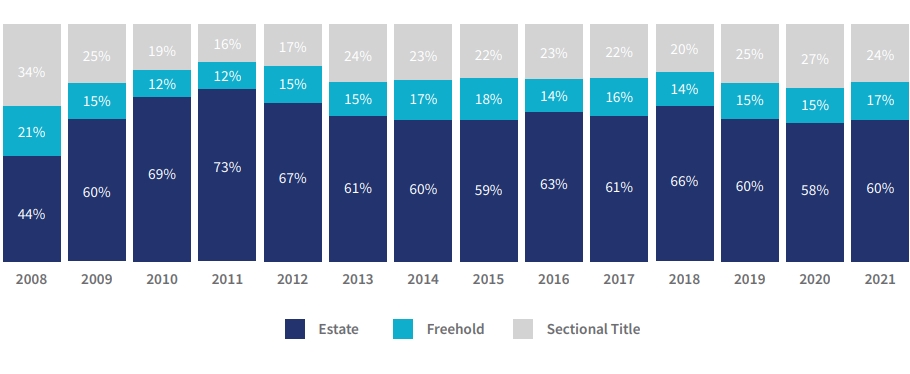
The trend away from Freehold and towards safer, more cost-efficient gated communities is continuing and we expect it will continue to do so.
Proportion of development

Solutions that simplify the complex
Our new website makes it easier to navigate and discover a range of Lightstone products and solutions that make it easier for you to do business.

One place to access your subscriptions
We’ve simplified the complex with a single sign on functionality. Simply login and you will have access to all the products that you currently subscribe to. All in one portal.

What’s happening to the old website?
A few links on our new website may redirect you to certain pages on the old website. This is just a temporary solution to ensure legacy users still have access to certain products.
.png)
.png)
.png)
.png)