Property Newsletter | February 2022
Flower power trumps the sun and sea on the Cape West Coast
Telemetry data highlights tourism’s value, Covid’s harm
The sparsely populated West Coast relies heavily on tourism for its income and aggregated anonymised telemetry data shows how Covid lockdowns have impacted the area’s economic sustainability.
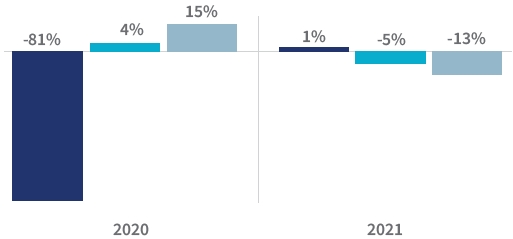
While Easter volumes in 2021 were much the same as pre-Covid numbers, the all-important flower season in August / September was down 5% while Christmas volumes were 13% down.
The two-month flower season attracts more visitors and greater daily volumes than either Easter or Christmas, highlighting the risks of climate change, other natural disasters or a pandemic such as Covid to the region’s economy.
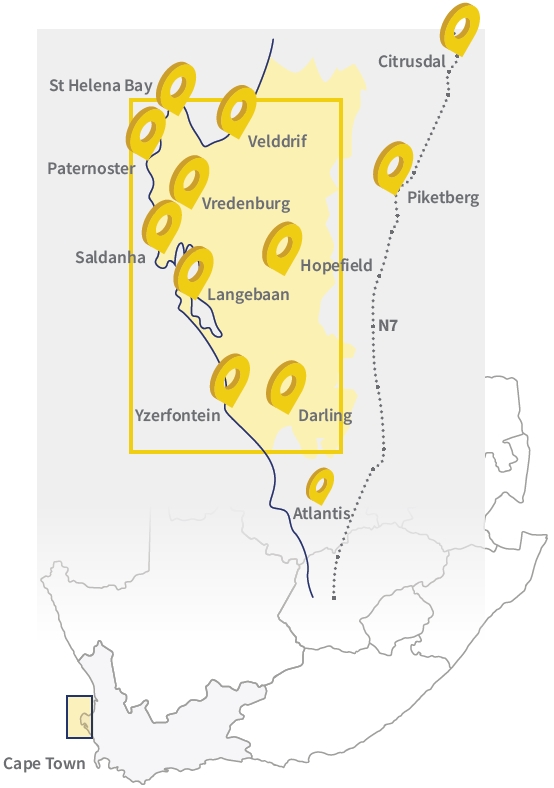
The West Coast – from Yzerfontein in the south to Velddrif in the north and stretching inland as far as Darling and Hopefield – is occupied by just 160 000 people. But the 4 300 square km area’s population has grown by 25% in the 10 years since the last census in 2011, compared to the national average of 16%, provincial average of 22.2% and the City of Cape Town’s 22.7%. The West Coast accounts for just 2.25% of the Western Cape’s population.
Aggregated, anonymised, upweighted telemetry activity demonstrates the fluctuating volumes and flows of vehicles over different timeframes.
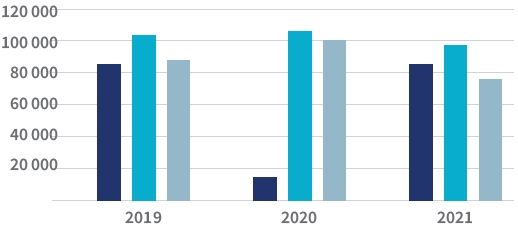
Total vehicle stop activity – counting a car everywhere it stopped, adding up to total visits at different places, not to total distinct vehicles in the greater area – highlights the higher daily vehicle activity during the “flower season” relative to Easter and Christmas. This is evident both before and during the Covid eras.
The West Coast had a strong 2020 Christmas and “flower season” after the 2020 Easter lockdown prohibited any movement other than local essential services and necessary shopping.
But while Easter levels in 2021 were at pre-Covid levels, both the “flower season” and Christmas activity fell away.
With various lockdown levels in play at different times, coupled with reduced bookings because of ongoing uncertainty around the different Covid waves, it remains to be seen if this downturn in activity is the “new normal” or if visitor numbers will return to or exceed pre-Covid levels in 2022.
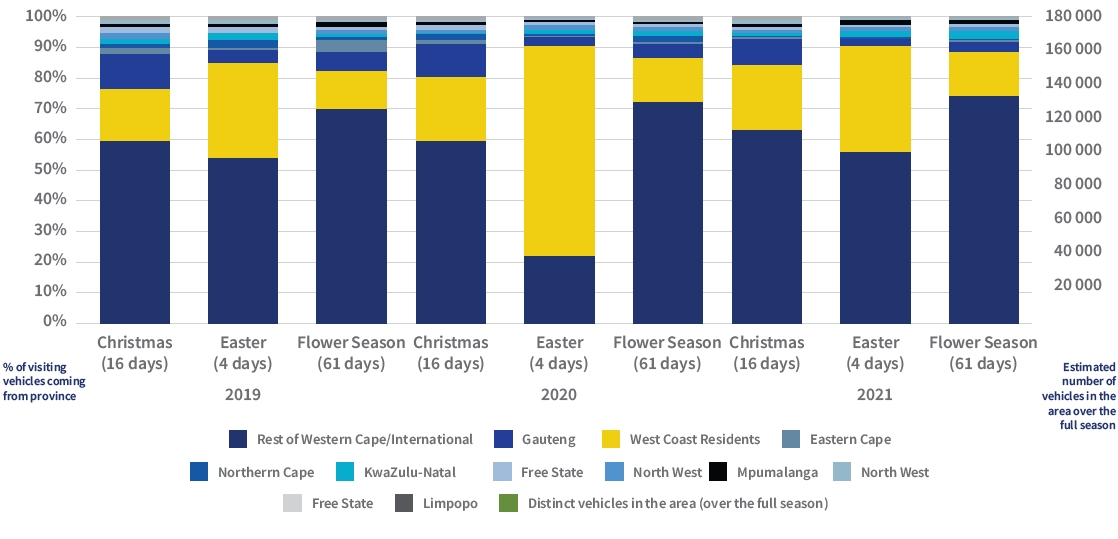
The majority (roughly 70% of “flower season”, 60% of Christmas and 50% of Easter) of the vehicles seen in the West Coast originate from other Western Cape areas. This would include Fly In2 visitors in Cape Town rentals.
The start-stop reopening of international travel and increased local travel by South Africans suggest numbers will climb as Covid wanes.
Estimated stop volumes per day within the West Coast
Change on pre-Covid activity levels

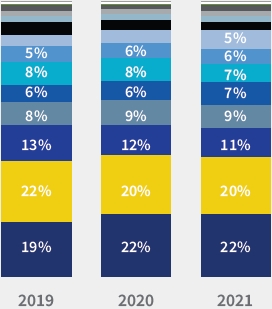
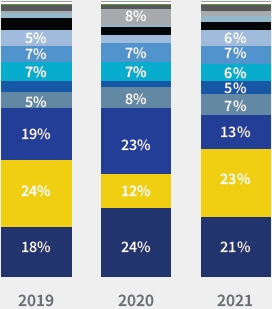
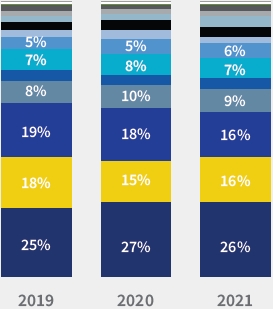
Vredenburg, Langebaan and Saldanha are the most popular destinations, and their share of the overall West Coast holiday season activity has risen post Covid from 54% to 60%.
Vredenburg does better during the “flower season” while the popular coastal town of Langebaan does better during Easter and Christmas.
Both Langabaan and Saldanha lost share of activity across all seasons during the lockdowns, while Vredenburg and Darling fared reasonably well.
Which towns receive the activity?
Christmas
Easter
Flower Season

Home province of visitors
NOTES
Holiday Periods are considered as:
- Easter: the 4 days of 19th to 22nd April 2019 / 10th to 13th April 2020 / 2nd to 5th April 2021
- Flower Season: the 61 days across the whole of August and September, annually
- Christmas: the 16 days from 16th to 31st December, annually
Telemetry data analysis upweights a comprehensive sample of 600 000 plus vehicles to represent the national picture based on complex methodologies. Implicit within the national picture is the rental car pool within a province, accessed by Fly In travelers. By and large, the data can be interpreted that vehicle origin from a province will include Fly In travelers arriving in rental vehicles from that province - and as such the inflow from Western Cape is to be interpreted as a combination of local Western Cape residents and Fly Ins.
Lightstone Location Solutions and Insights
Combining comprehensive data assets, expert analytics and world-class platforms, Lightstone’s location intelligence solutions elevate your network strategies and enable your business clients. Our offerings help solve problems, understand customers and locations and identify business opportunities.
Do you want to know more about Lightstone’s location intelligence solutions?
Email Lightstone at info@lightstone.co.za and an expert consultant will be in touch with more information

Solutions that simplify the complex
Our new website makes it easier to navigate and discover a range of Lightstone products and solutions that make it easier for you to do business.

One place to access your subscriptions
We’ve simplified the complex with a single sign on functionality. Simply login and you will have access to all the products that you currently subscribe to. All in one portal.

What’s happening to the old website?
A few links on our new website may redirect you to certain pages on the old website. This is just a temporary solution to ensure legacy users still have access to certain products.
.png)
.png)
.png)
.png)