Property Newsletter | March 2022
Uneven commercial property activity reflects challenging times
Non-residential property (13million or 16% of deeds registered stock) broadly falls in 3 categories:

Agricultural (25%)
Non-commercial ie government, water, mining, etc (25%)
Commercial (50%)
Some 60% of current agricultural stock was registered at the South African Deeds Off ice before 1994, and registrations continued to increase rapidly until 1999, when they levelled off , with agricultural stock registrations rising by only 10% since then.
Non-commercial grew off a lower base and followed a gentler but more sustained growth trajectory than agri, slowing in the mid-2000s.
Unsurprisingly, the highest proportion of commercial registrations have taken place since 1994.
Year of first registration

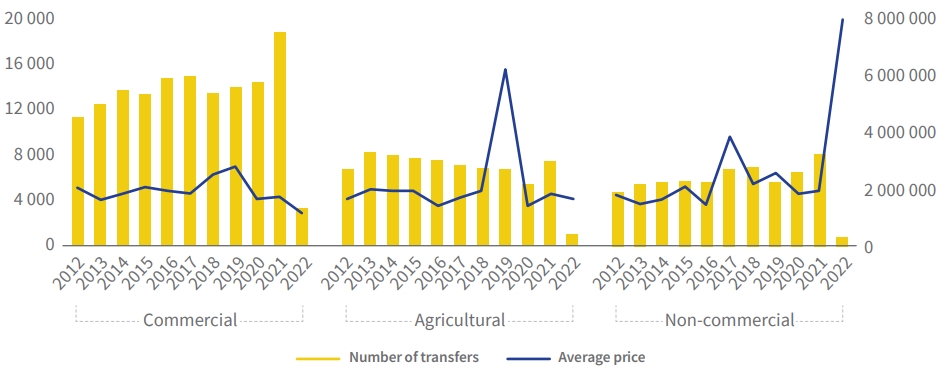
As expected, the greater number of Commercial properties results in more transfer volumes than in Non-commercial and Agricultural (see graph below). Transaction volume increases and declines tell a clear story, but average value fluctuations need to be treated with some caution: single year spikes in average prices are almost certainly attributable to the stock type makeup of the transactions eg a year dominated by small farm transfers followed by a year dominated by a large farming operation transfer.
When a trend becomes apparent – such as the sustained decline in commercial prices – it may be more indicative of less stock activity because of Covid-19 than of actual value decline.
It is clear, however, that overall there has been little value growth realised in these markets. Covid dampened Agricultural market activity levels substantially, although volumes had been falling since 2014. Commercial and Non-commercial activity levels continued to see uneven growth.
Transfer volumes and values - last 10 years

As would be expected, volumes are highest in Gauteng, with provinces with large metropolitans skewed towards Commercial activity while rural provinces naturally have more Agricultural activity.
Non residential property activity by province

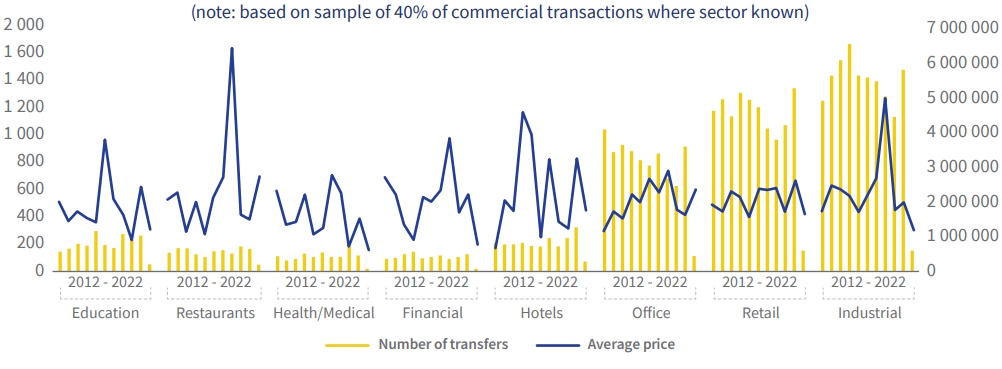
90% of the commercial sample where the sector is known, falls within one of eight sectors. Analysis of this eight-sector sample over the last ten years shows transaction volumes are highest in the Industrial sector, followed by Retail and then Off ices.
While average values were reasonably volatile across the years in most sectors, it is notable that ‘Office’ prices were on a steady growth trajectory until Covid, when they plummeted (albeit volumes increased in 2021, reversing the negative volume trend, possibly as no longer wanted off ice space was sold off into other sectors). The small volume of 2022 YTD Off ice sector sales do show a promising price recovery.
Transaction volumes and prices per year per Commercial sector

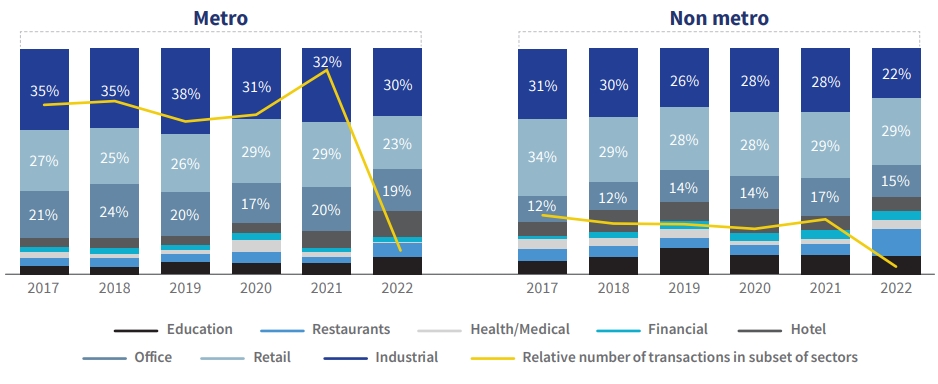
Considering the same volume (not price) component of the information as above, but limited to the last five years and split between metropolitan focused provinces (Gauteng, Western Cape and KwaZulu-Natal) against rural focused provinces (the other six provinces), we see roughly 75% of transfers in all the Commercial sectors are within the metropolitan provinces.
Sector share of activity has largely remained static, with some notable exceptions: the medical sector’s small share of activity swelled in metropolitan areas but declined in non-metropolitan areas in 2020, while hotel activity in rural areas increased its share of activity at the same time and restaurants are seeing a strong contribution to activity in 2022 YTD, although it is unknown if it is positive renewal or negative selloff .
Selection of sectors: volume contribution change over last 5 years


Solutions that simplify the complex
Our new website makes it easier to navigate and discover a range of Lightstone products and solutions that make it easier for you to do business.

One place to access your subscriptions
We’ve simplified the complex with a single sign on functionality. Simply login and you will have access to all the products that you currently subscribe to. All in one portal.

What’s happening to the old website?
A few links on our new website may redirect you to certain pages on the old website. This is just a temporary solution to ensure legacy users still have access to certain products.

.png)
.png)
.png)
.png)