Property Newsletter | March 2022
Where have all the (younger) homeowners gone?
Emigration, lifestyle change, economic hardship or waiting for a bargain?
Some 128 749 homeowners left the market in 2021, selling properties valued at R200 billion at an average of R1.8 million per property – and it’s noticeable that the pendulum has swung towards younger homeowners leaving the market.
The volume and average value of properties
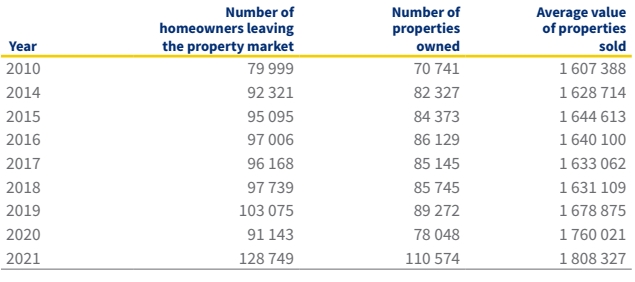
The 128 749 sellers are 25% more than the average from 2014-2020, and 27% more if 2010 is included. In the years 2014-2020, some 672 547 homeowners exited the market at an average of 96 078 a year. The average is significantly up on the 79 999 who sold and did not repurchase in 2010, the year SA hosted the FIFA World Cup.
The profile of sellers changed significantly from 2010 to 2021, swinging from older to younger, and there are many potential reasons for this. Tougher economic conditions – exacerbated by Covid-19 – were taking their toll and forcing younger people out of their homes. Emigration could be a factor too, while some sellers may be waiting for prices to fall to buy at bargain prices. Then again, younger people are typically adopting a “live light” philosophy, and this could also account for some of the shift.
While the impact of Covid-19 has obviously played a role in the market, attention is now shifting to the Russian invasion of Ukraine and the market is waiting to see its impact on the SA economy and how it might affect residential house sales.
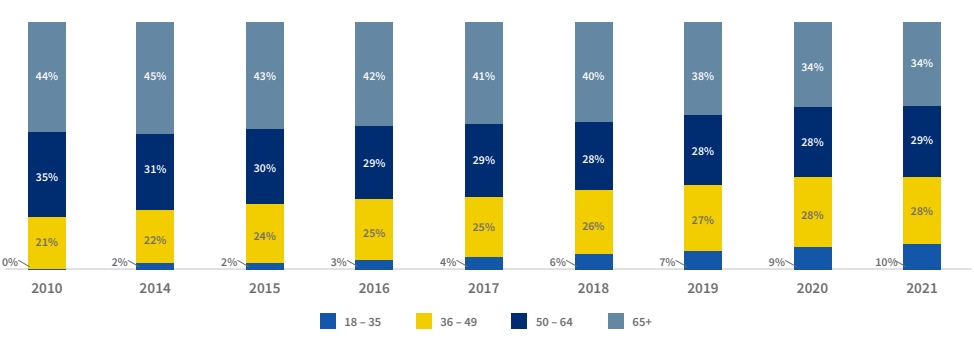
In 2010 those leaving the market (see graph below) were predominantly in the older age groups, between 36 and 49 years of age (21%), 50-64 (35%) and the 65+ age group was the largest category at 44%. In 2021, this was significantly different, with 10% of sellers being in the 18-35 age group, up from 0% in 2010. The 36-49 group went from 21% to 28%, while the 50-64 age group dropped from 35% to 29% and the 65+ age group fell from 44% to 34%
In summary, those under 50 now account for 38% of sellers as opposed to 21% in 2010.
Age group of people leaving the property market – %
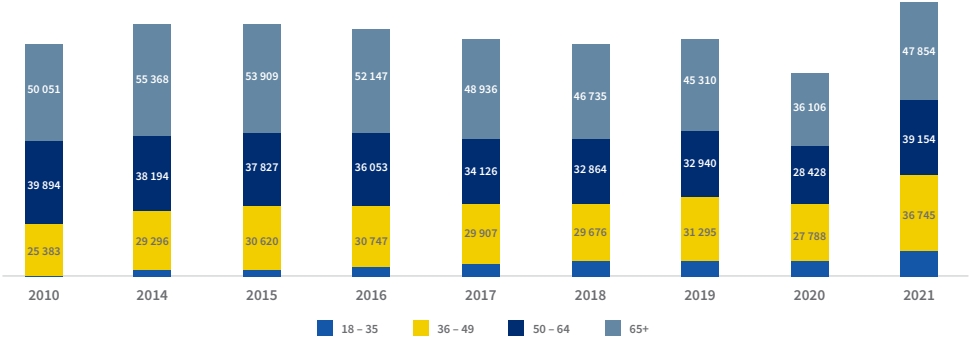
The number of people per age group leaving the property market
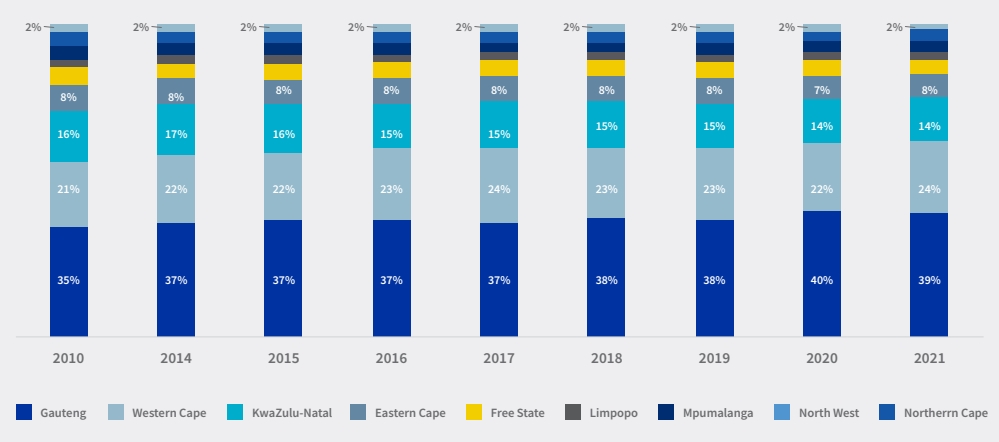
The current value of properties sold by province:

40% of those selling up come from Gauteng, with 24% from the Western Cape and 14% from KwaZulu-Natal.
Province where property was sold
Gender by age band
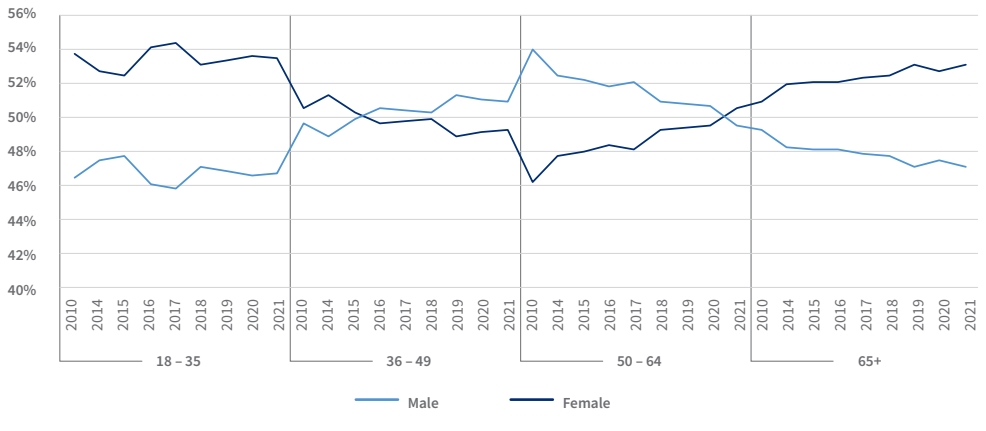
Females make up most sellers in the 18-35 age group and again in the 65+ age group, with males outselling females between 36-64.

Solutions that simplify the complex
Our new website makes it easier to navigate and discover a range of Lightstone products and solutions that make it easier for you to do business.

One place to access your subscriptions
We’ve simplified the complex with a single sign on functionality. Simply login and you will have access to all the products that you currently subscribe to. All in one portal.

What’s happening to the old website?
A few links on our new website may redirect you to certain pages on the old website. This is just a temporary solution to ensure legacy users still have access to certain products.

.png)
.png)
.png)
.png)