Property Newsletter | May 2022
Overstrand travel, work and shopping patterns back to pre-Covid patterns
Vehicle activity and travel, work and shopping behaviour patterns have generally returned to pre-lockdown levels in Overstrand, with a slight increase likely due to population growth in the area. The return to previous patterns suggests Overstrand has been largely unaffected by the “work-from-home” culture shift that is prevalent elsewhere following the lockdowns of 2020 and 2021.
This is according to an analysis of telemetry data devices installed in vehicles, with trips weighted to allow for results corresponding to the overall Car Parc (all registered vehicles within a defined geographic region).
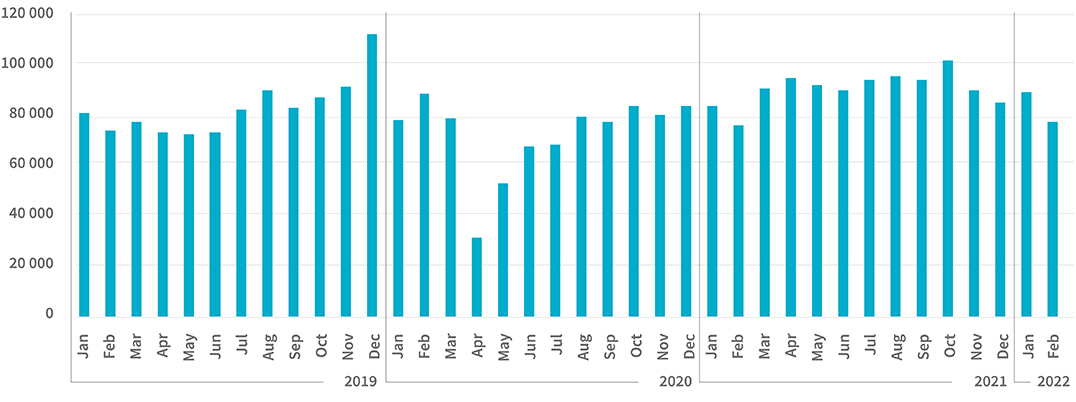
Lightstone considered weighted trips ending in Overstrand from 2019 to 2022.
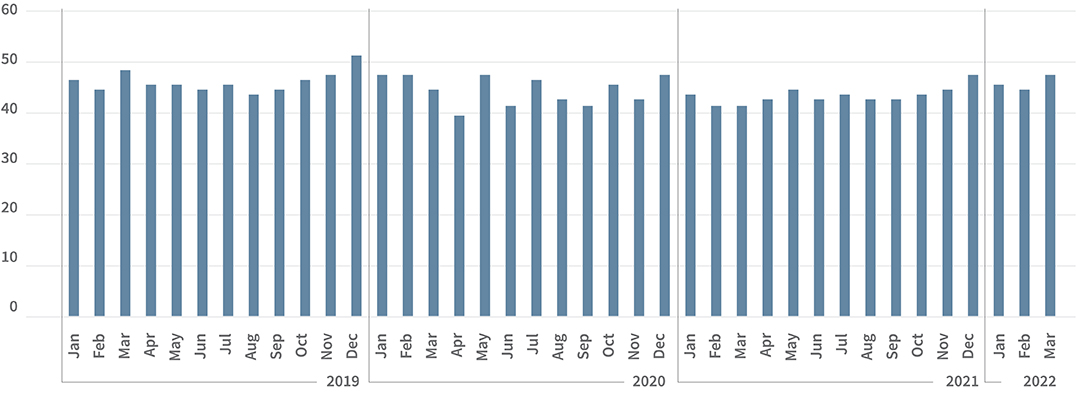
Number of trips per month (Overstrand overall)
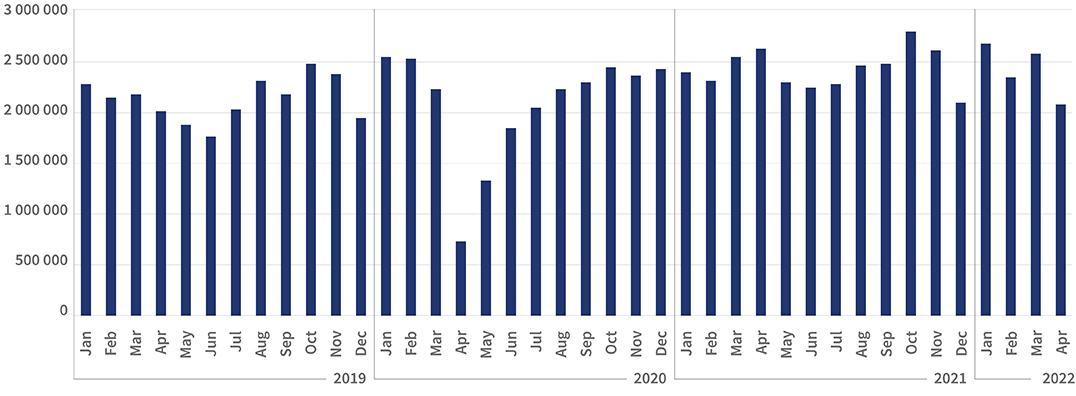
Overall vehicle trips in the Overstrand area (see graph above) dropped during the peak lockdown period which started in April of 2020, but quickly recovered to pre-lockdown levels, and are in fact currently slightly higher than what they were in 2019.
Patterns within individual towns in Overstrand are similar to the overall pattern, generally showing a quick, full recovery to pre-lockdown trip numbers.
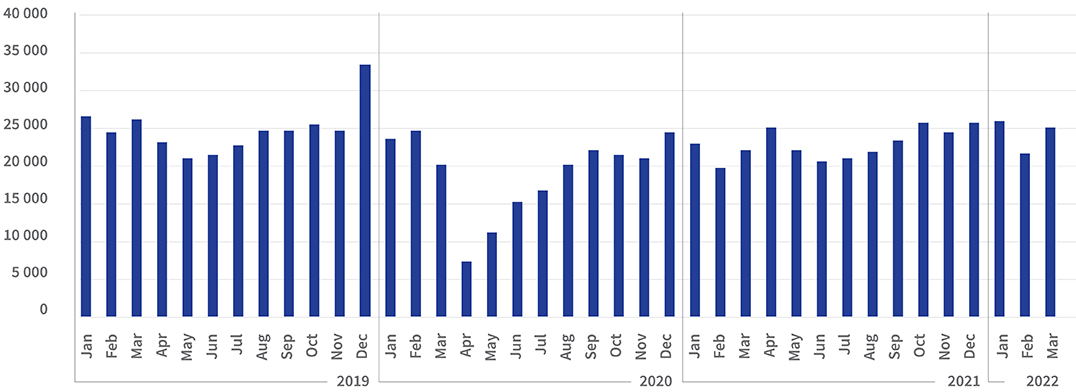
Betty's Bay
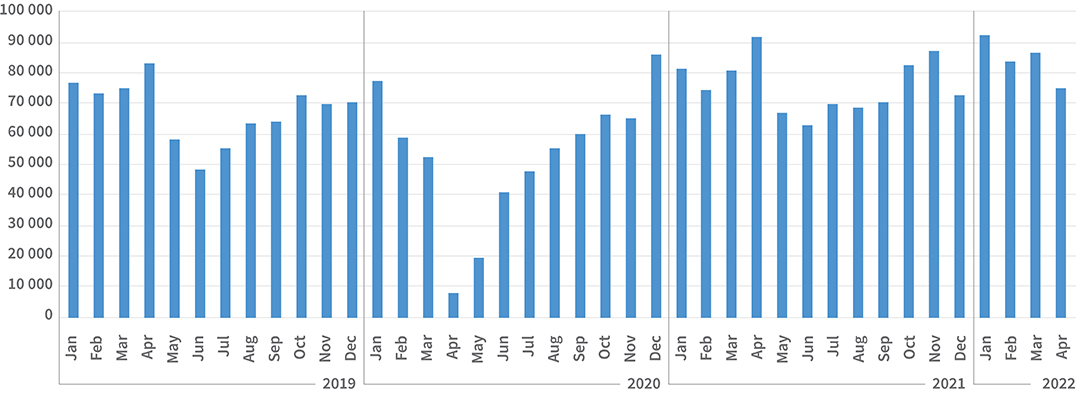
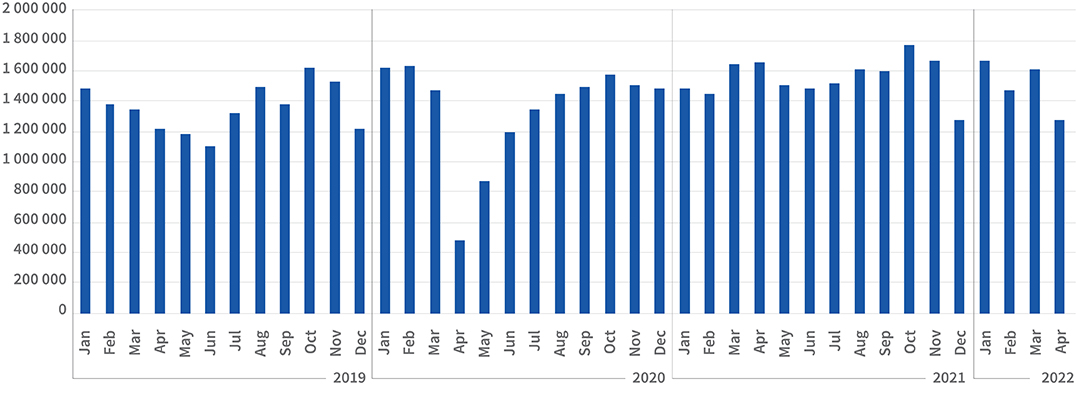
Betty’s Bay (graph above) is one of four towns, along with Gansbaai, Kleinmond and Pearly Beach, where activity has increased when comparing Q4 2019 to Q4 2021, while Hermanus (graph below) appears to have recovered to pre-pandemic levels.
Hermanus
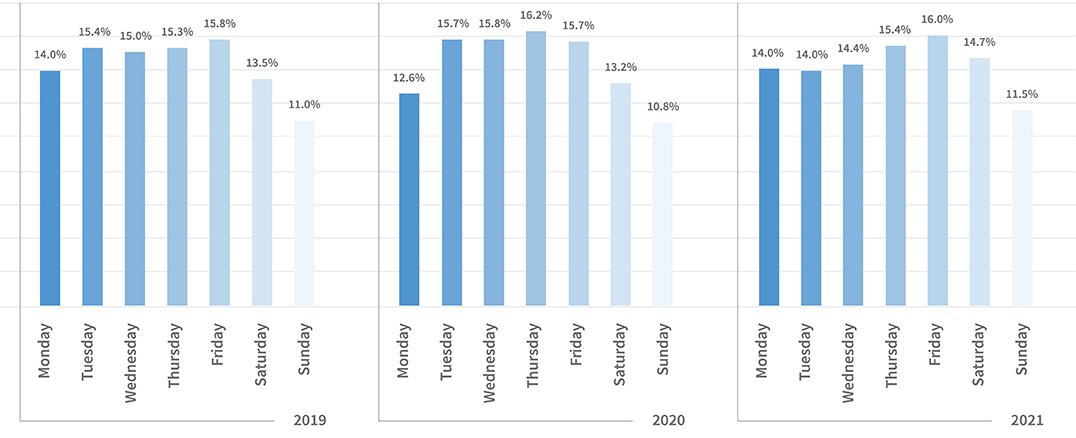
Vehicle activity post-lockdown is slightly more evenly distributed across the week.
The proportion of trips over the weekend is slightly up on the number previously recorded but still slightly lower than the weekday trips recorded.
April Trips by Weekday - Overstrand overall
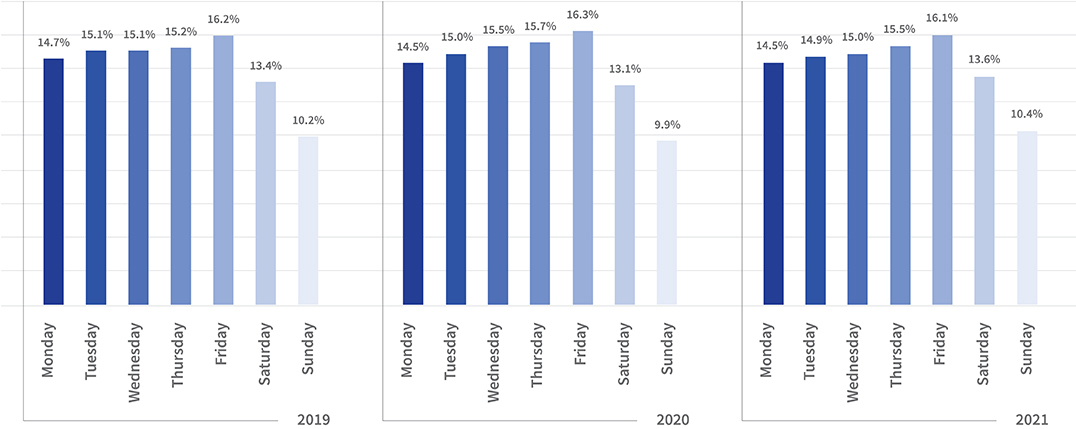
Total Trips by Weekday - Overstrand overall
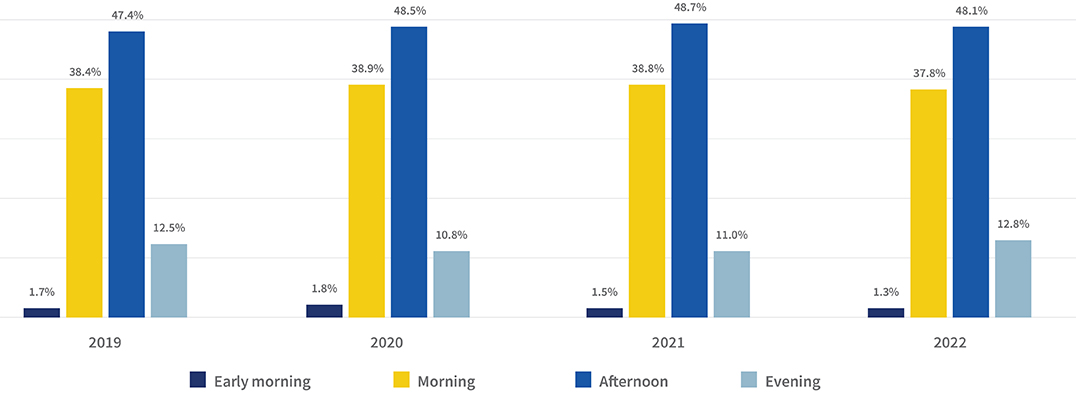
Trips by time of day:
During lockdown, there were fewer trips during the evening and early morning due to curfews. However, the overall impact over the course of the year was insignificant.
Total Trips by Time of Day - Overstrand overall
In addition to monitoring general area activity, Lightstone can also monitor specific destinations. For this study, Lightstone zoomed into vehicle activity at the Whale Coast Mall, the most popular mall in the area. The patterns here suggest behaviour closely resembles pre-lockdown behaviour, but the lockdowns did affect activity during the December holidays of 2020 and 2021.
Visits - Whale Coast Mall
Visits - Whale Coast Mall
Stop duration - Whale Coast Mall
.png)
.png)
.png)
.png)