Property Newsletter | May 2022
Back-to-work benefiting business parks and secondary CBDs
Back-to-work benefiting business parks and secondary CBDs
Business parks and secondary CBDs are leading the post Covid-19 recovery in terms of activity, followed by industrial nodes, then primary CBDs and lastly mixed residential.
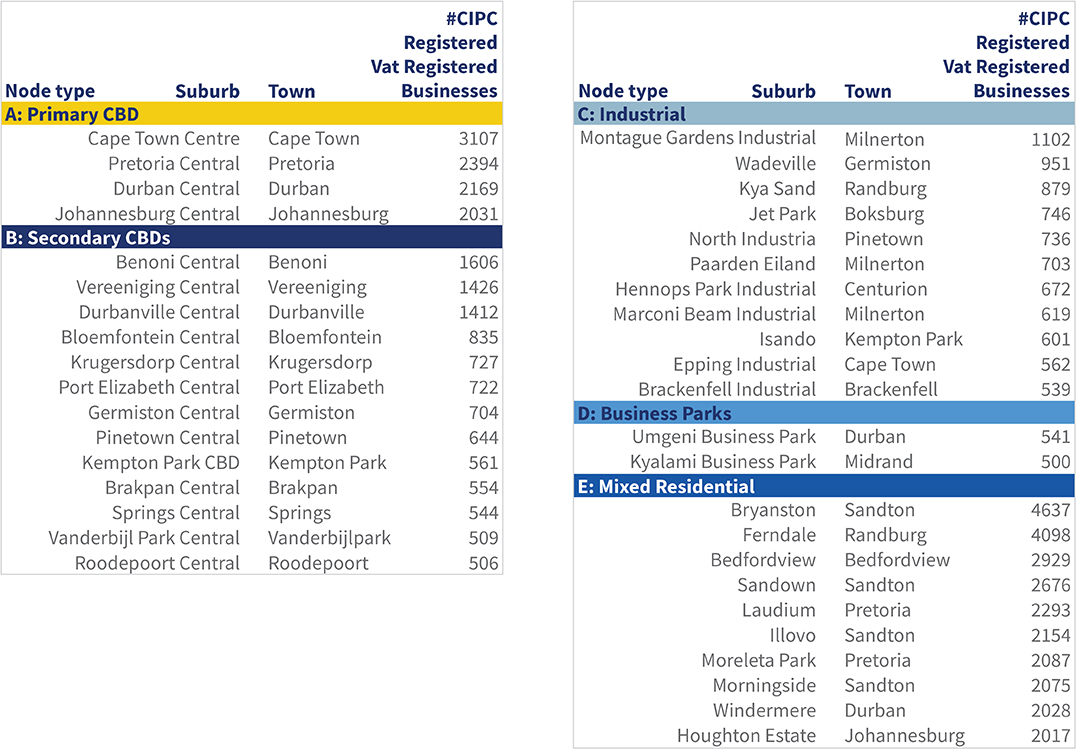
Lightstone analyses aggregated and anonymised telemetry data in conjunction with business data to uncover levels of post-Covid recovery. CIPC and VAT registration data was accessed to identify business nodes. Deep dive analytics would spread the net wider, but this article considers 40 metropolitan suburbs as South Africa’s key business nodes where either the suburb holds 2 000+ VAT registered businesses within them or only 500+ but suburb naming convention indicates a CBD/industrial/business area supplemented with a handful of other well-known industrial areas.
These 40 suburbs have been clustered into one of five node ‘types’ namely:
- Primary CBDs – Pretoria, Johannesburg, Cape Town and Durban
- Secondary CBDs – the area surrounding CBDs eg Alberton Central
- Industrial areas –like Kya Sands, Isando, Paarden Eiland
- Business Parks – eg Umgeni Business Park
- Mixed residential – areas with a strong interspersed residential and business focus eg Bryanston, Sandown, etc.
The table shows the 40 suburbs within their node type with the 65% of them that are Gauteng-based colour coded accordingly on the map.
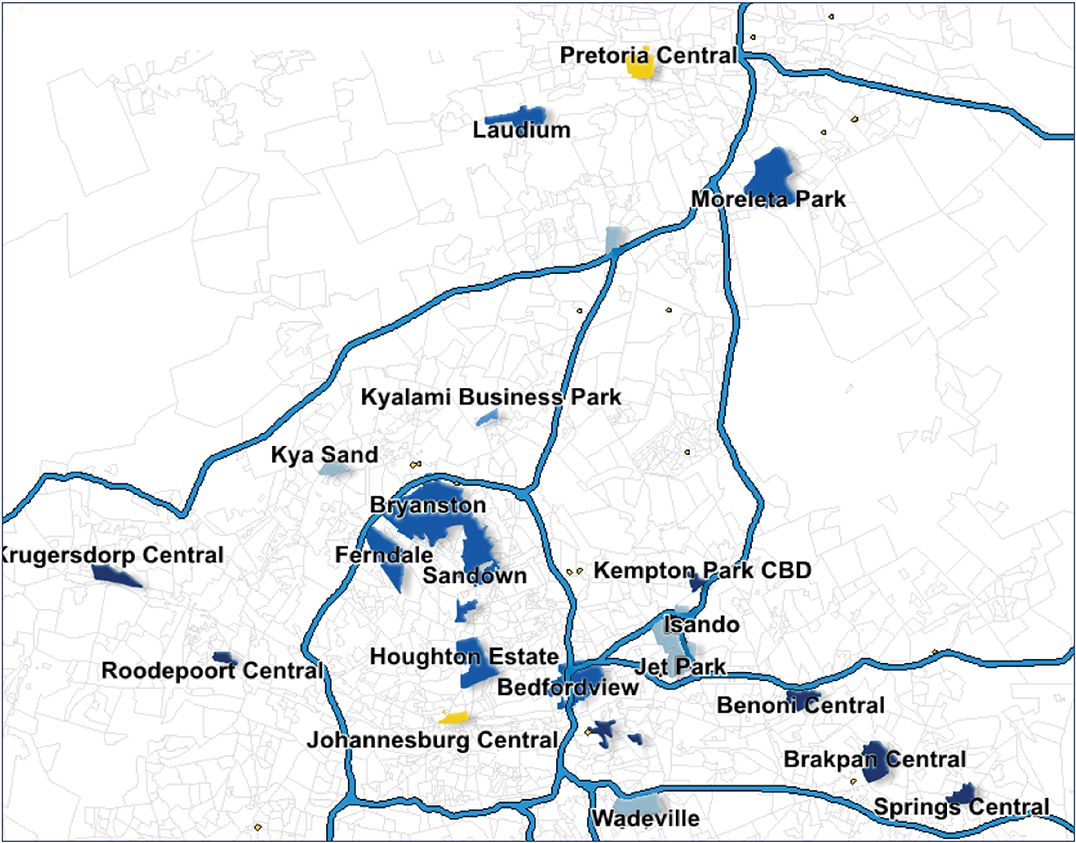
Telemetry data allows for an understanding of stop activity within these nodes. Limiting our lens to this activity that is both non-resident and not retail-based, within business hours, provides sound insights into business activity levels and recovery per node.
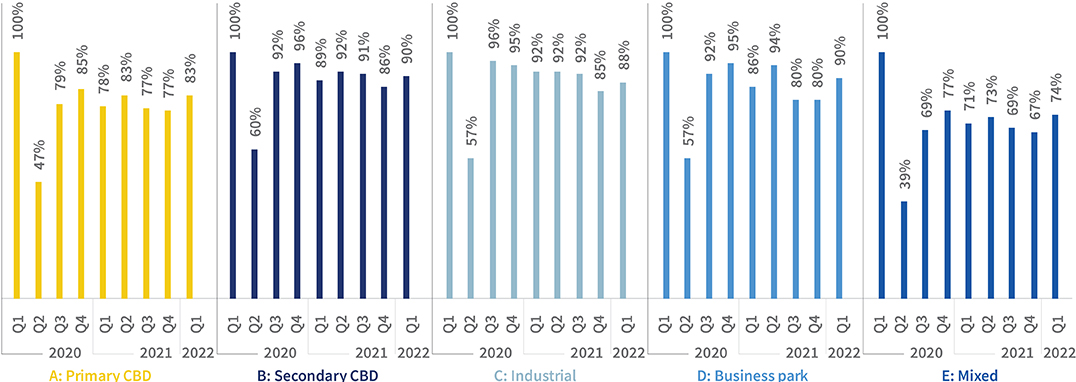
Considering quarterly volumes of these stops against 2020 Q1 volumes we see that business parks and secondary CBDs have recovered most, followed by industrial nodes, primary CBDs and lastly Mixed residential. Where the graphs indicate 100% it means the activity has fully recovered to pre-Covid times.
Business activity recovery
# of non-residential non-retail stops in the nodes in the quarter
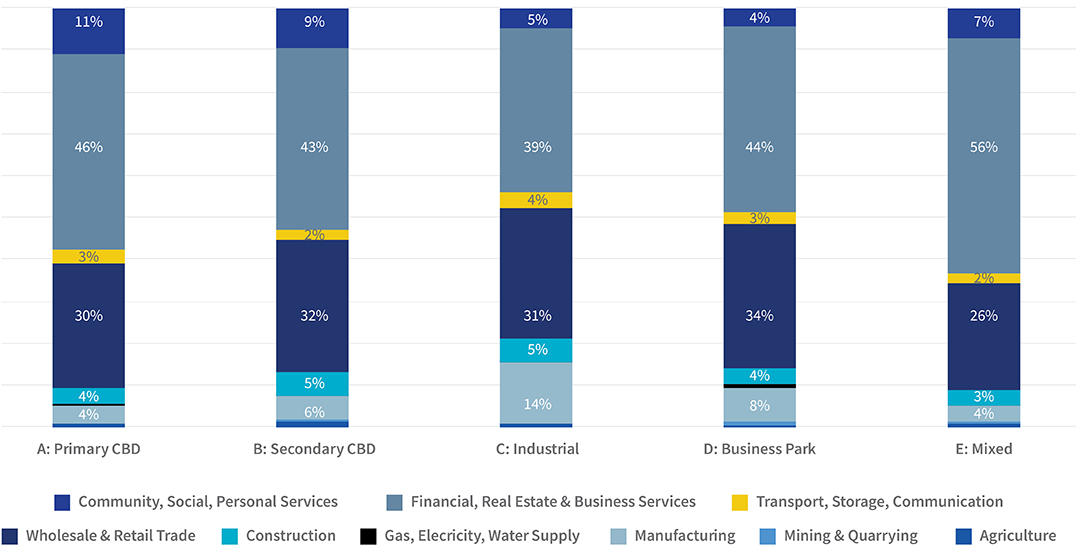
The greater post Covid impact on the Mixed residential node is likely attributable to the type of business found in these areas (56% of CIPC/VAT registered businesses in Mixed residential suburbs are Financial, Real Estate & Business Services) lending themselves to employees logging-in remotely.
% of Vat registered businesses, per SIC code
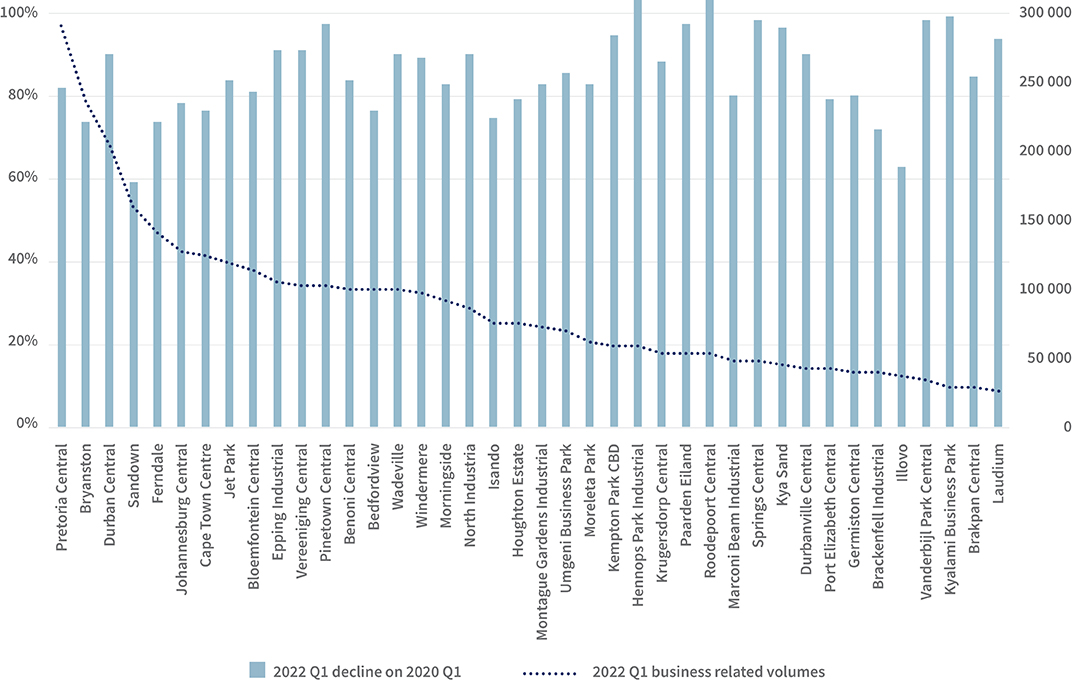
Although the decline in Mixed residential node activity was the biggest in terms of percentages, activity volumes still remained significant. For example, while Sandown is only operating at 59% of its pre-Covid level, it still has the fourth highest activity volume of the 40 suburbs reviewed.
Current quarter volumes per suburb vs decline
.png)
.png)
.png)
.png)