Property Newsletter | November 2021
Western Cape is first choice for semigrants
Middle class homeowners are leaving Gauteng in increasing numbers with the Western Cape as their preferred semigration destination.
This was among the main findings of an assessment of semigration trends presented by Lightstone’s Head of Digital, Hayley Ivins-Downes, to the virtual REIS Real Estate Industry Summit recently.
A view of the total property stock across South Africa
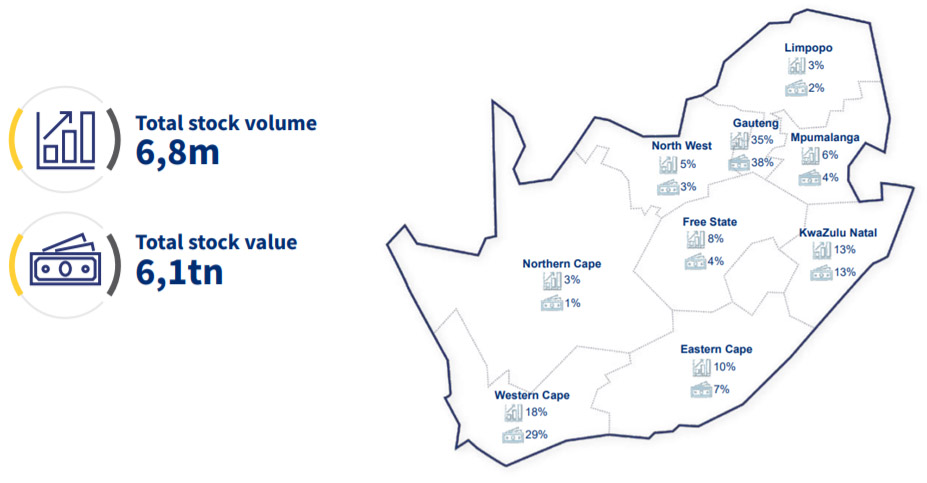
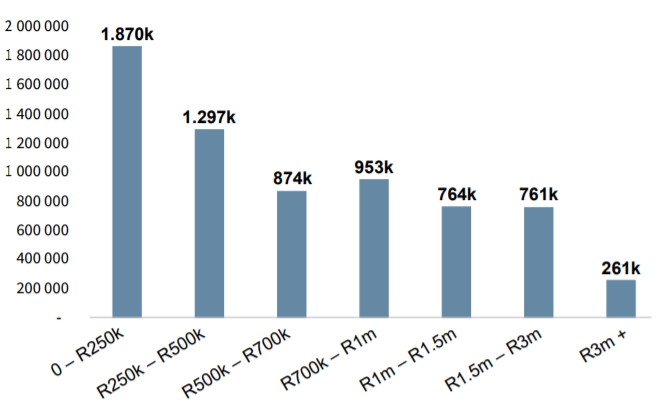
Interestingly, as the graph below shows, properties valued at less than R250k account for 1.870k properties, and those valued at between R250k-R500k number 1.297k – that’s 3.167k or 47% out of a total of just under 6.8m. Properties under R1m in value number 4 994, or 74% of the total market.
Property stock by value band
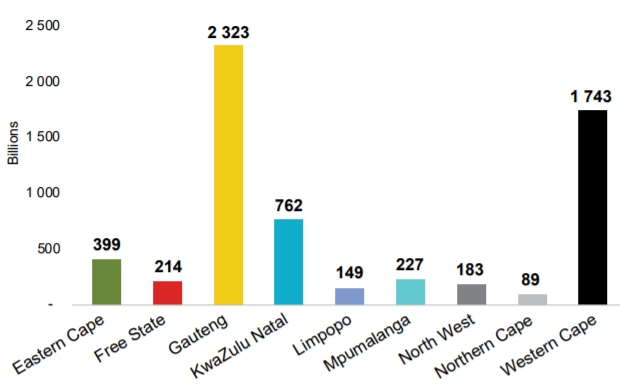
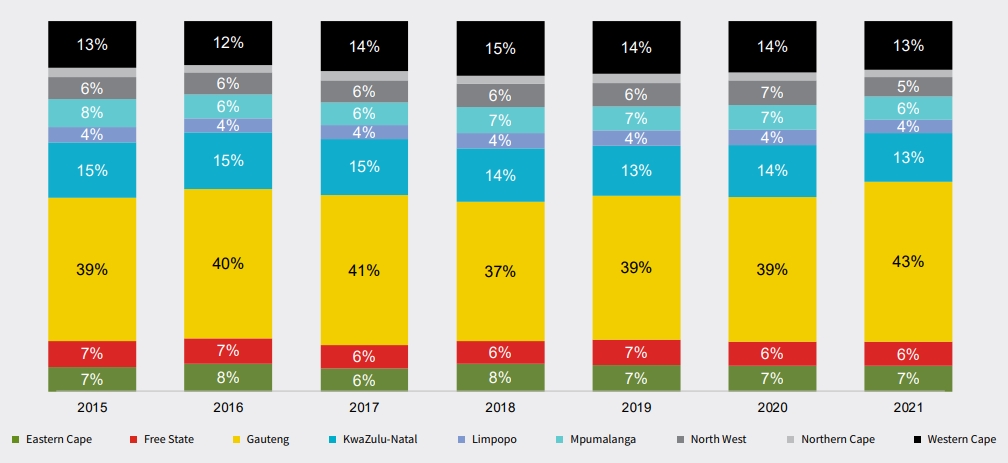
Total value of stock by province
While the bulk of properties sits in the lower price bands,transfers since 2008 have shifted away from properties in the under R500k band – which was then the leading category – to properties in the R1m-R3m band, the leading category since 2018.
The tough economic conditions are hurting the lower price bands more than the mid-market’s R1m-R3m band or the high band of R3m+, which has also increased since 2008.
Transfers by purchase band
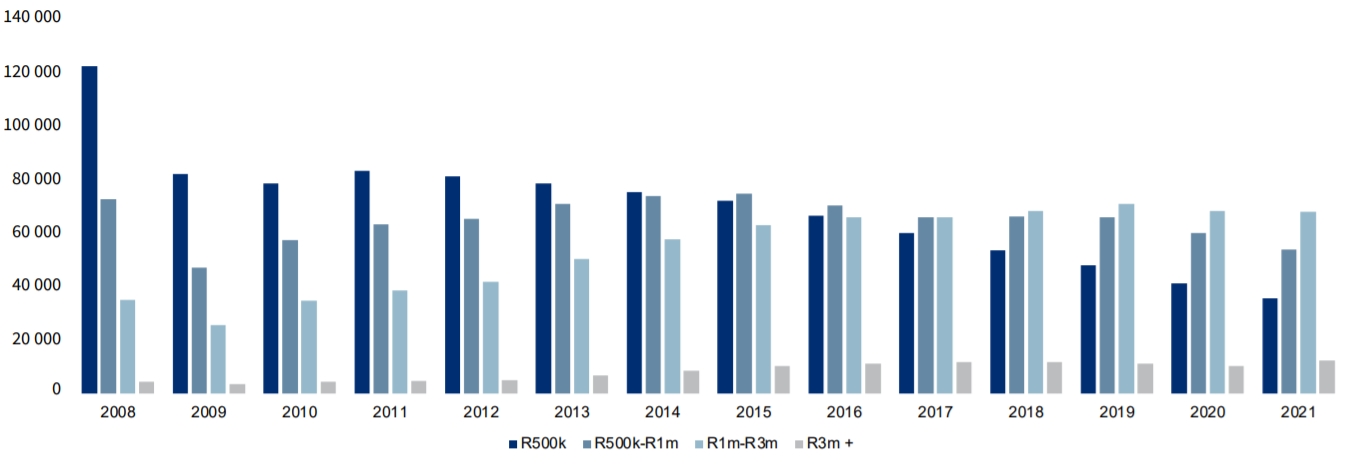
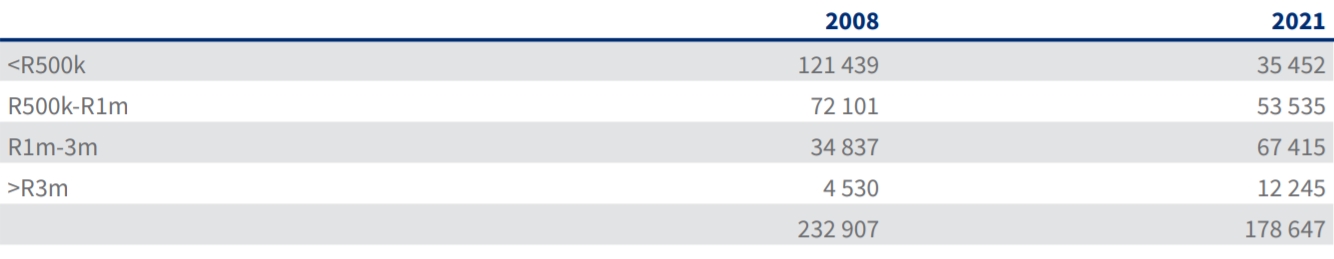
The table above demonstrates the shift since 2008 - entry level transfers were the highest at 121 439, and they have dropped to 35 452, now the second lowest category. The R500k-R1m category has also declined, but not as spectacularly, from 72 101 to 53 535. Both the R1m-R3m and >R3m categories have risen.
While the increase in the latter categories is welcome, the decline in the number of transfers under R1m is cause for concern.
House price inflation by value band
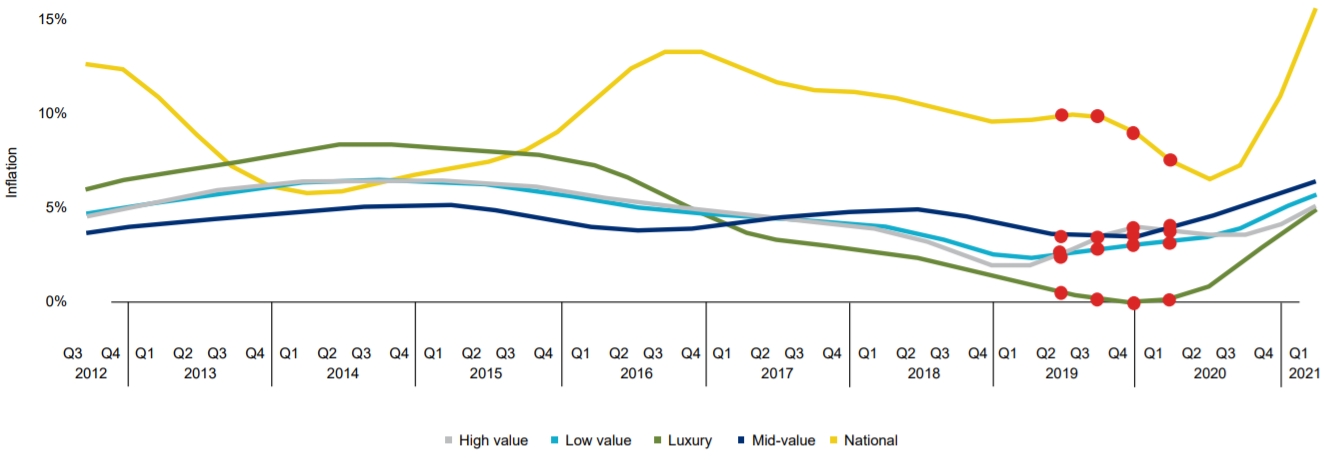
Covid-19 affected house prices in different ways-and it was luxury pricing which fell the most, but which has recovered strongly. Low, mid and high value homes are also recovering, and the market overall is moving upwards.
Where are people semigrating from and to?
We are seeing a substantial increase of homeowners moving out of Gauteng – despite it being South Africa’s economic centre – an increase from 39% in 2019 and 2020 to 43% in 2021, the highest it has been in the last seven years.
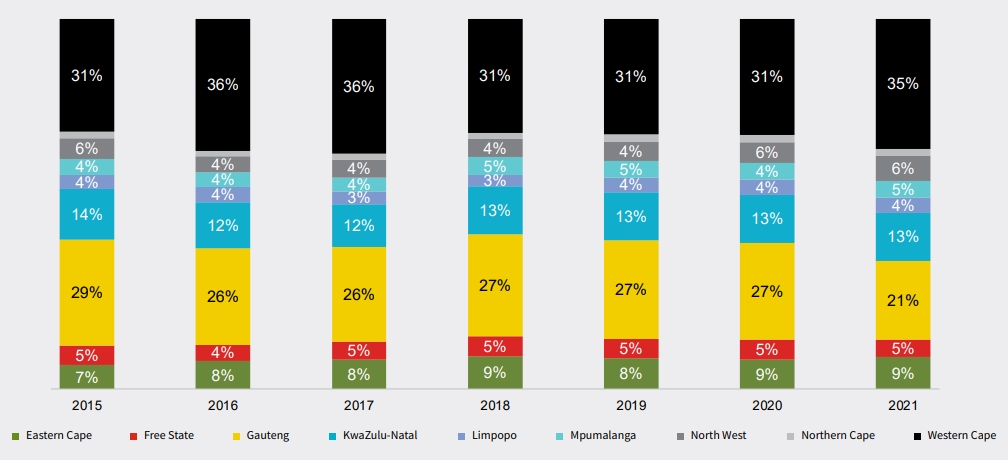
Most people are moving to the Western Cape, up to 35% in 2021 from 31% in 2020. The numbers were even higher at 36% in 2016 and 2017. For Gauteng, its declining popularity is evident in this data too – whereas in 2015, 29% of semigrants were moving to Gauteng, this had dropped to 27% in 2020 and to 21% in 2021.
There has been an increase to the Eastern Cape from 7% in 2015 to 9% in 2021, while KwaZulu-Natal has dropped marginally from 14% in 2015 to 13% in 2021. The impact of the civil unrest in KwaZulu-Natal in July this year, if any, has yet to make itself felt in the numbers.
What’s driving semigration?
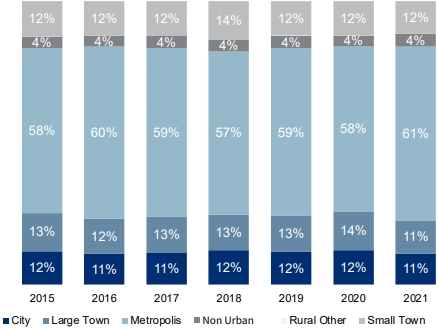
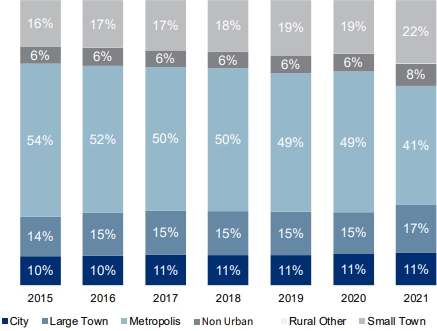
The trend towards moving from metropolitan areas to smaller and larger towns or Cape Town – South Africa’s second largest metro – can mostly be attributed to a move away from crime-and-grime and towards a slower, safer, quality lifestyle in the small to large towns. Semigrants are also attracted to the fact that municipalities are typically better run in the Western Cape than in other parts of the country.
Size of town moving from
Size of town moving to
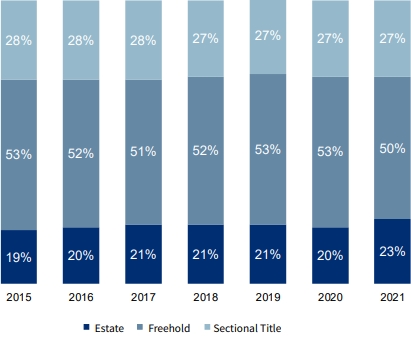
Property type moving from
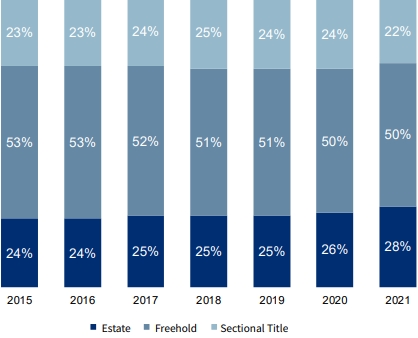
Property type moving to
Most semigrants are leaving Gauteng, and most are going to the Western Cape. The two graphs below highlight those leaving, and the high numbers in Gauteng are in stark contrast to the much lower numbers in the Western Cape.
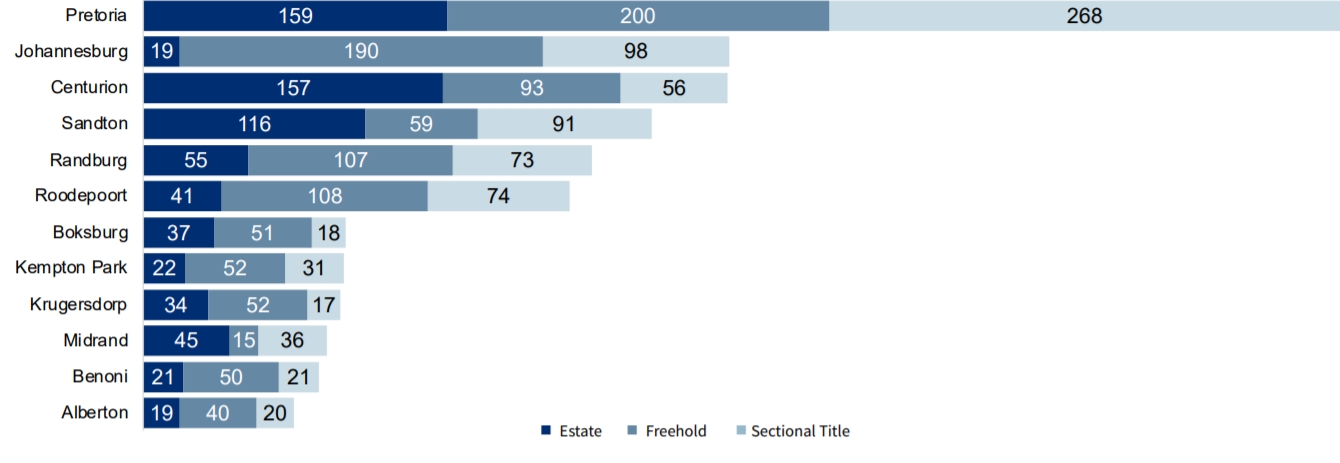
Semigration from Gauteng in 2021, showing highest volume towns
Semigration from Western Cape in 2021, showing highest volume towns
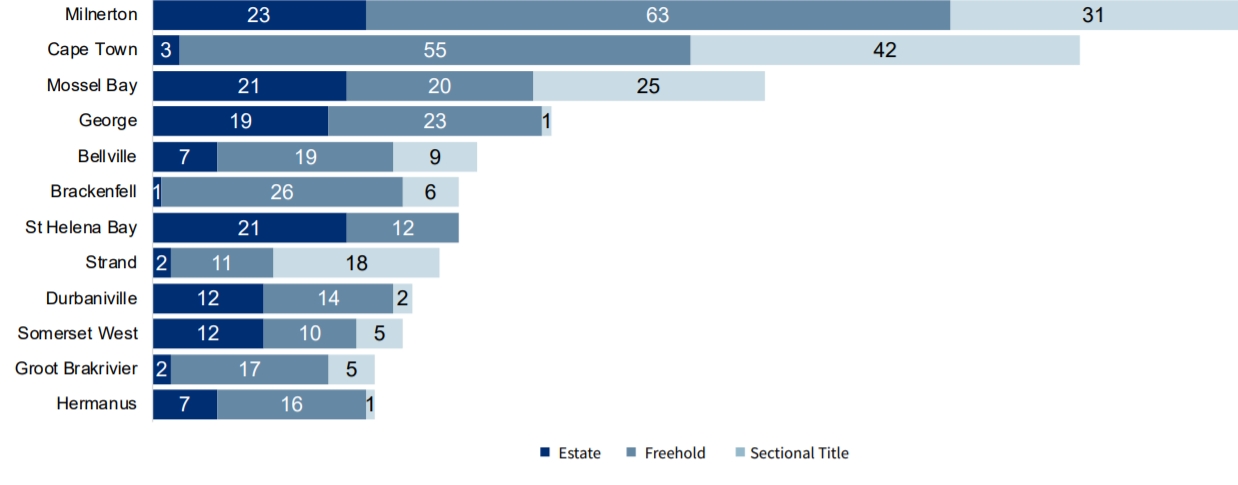
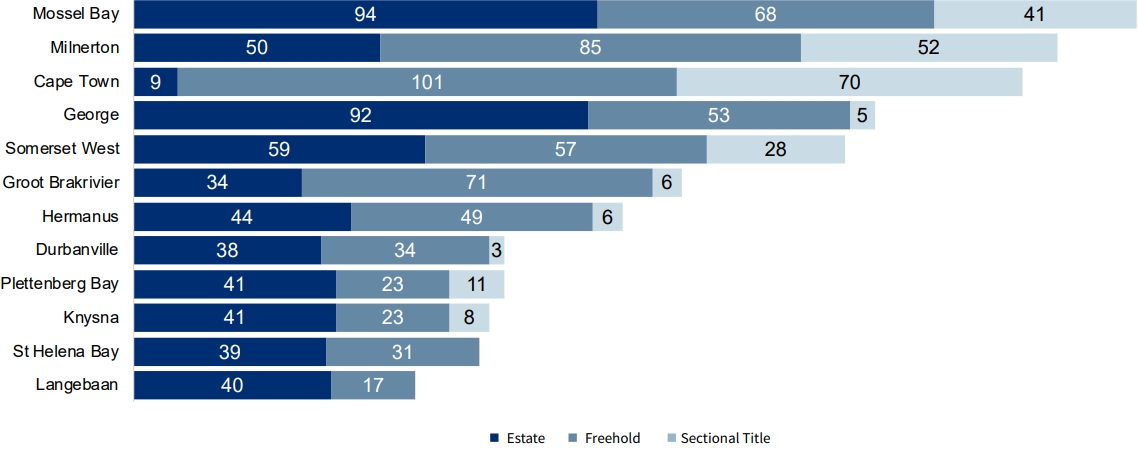
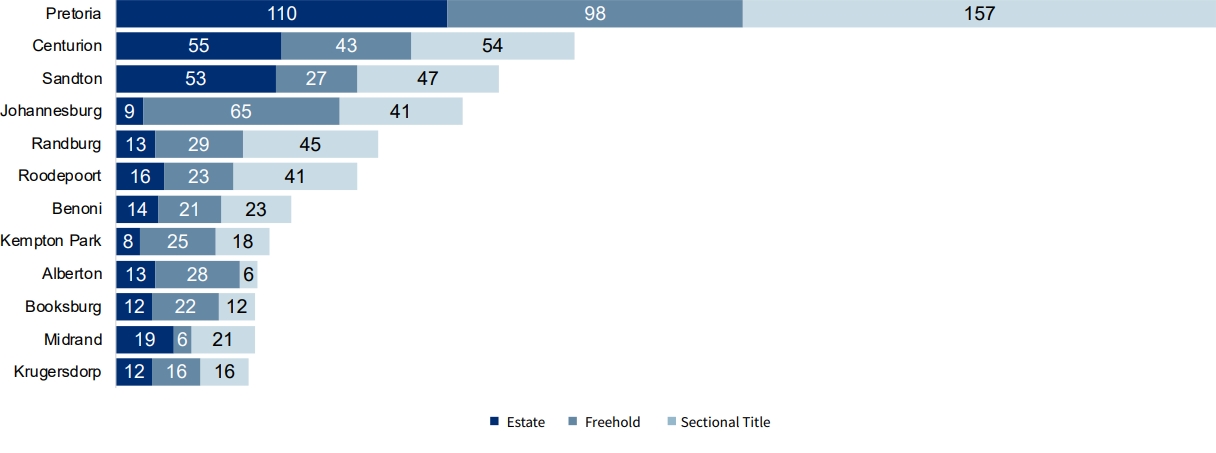
While the numbers of people moving to Gauteng are relatively high, they are less than those leaving. With the Western Cape, it’s the other way around, with more people arriving than leaving (see graphs below).
Semigration to Western Cape in 2021, showing highest volume towns
Semigration to Gauteng in 2021, showing highest volume towns
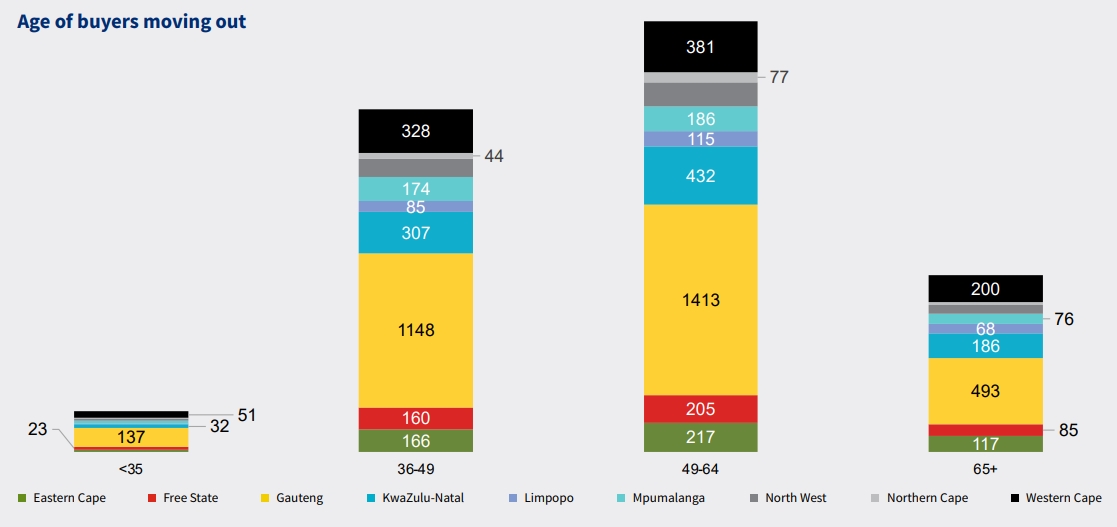
Who’s moving?
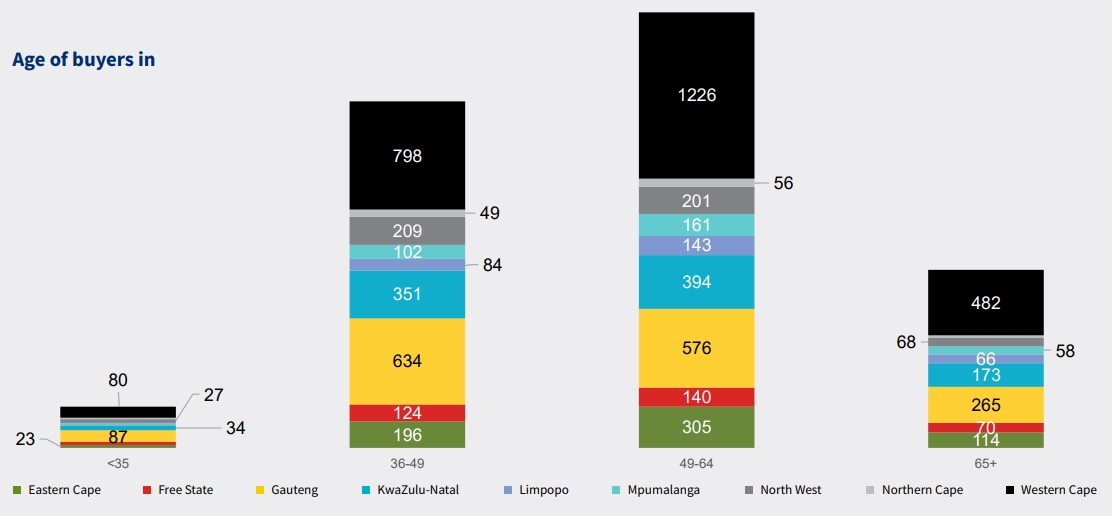
Most people moving are in the 49-64 age group, and most of that group are moving to the Western Cape. The 36-49 age group makes up the second largest category and again the Western Cape is their preferred destination.
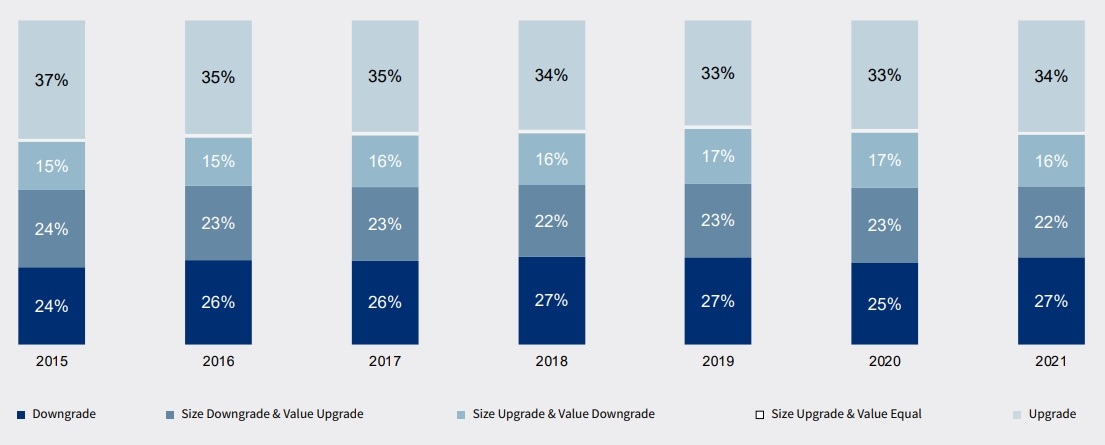
Are people upgrading or downgrading?
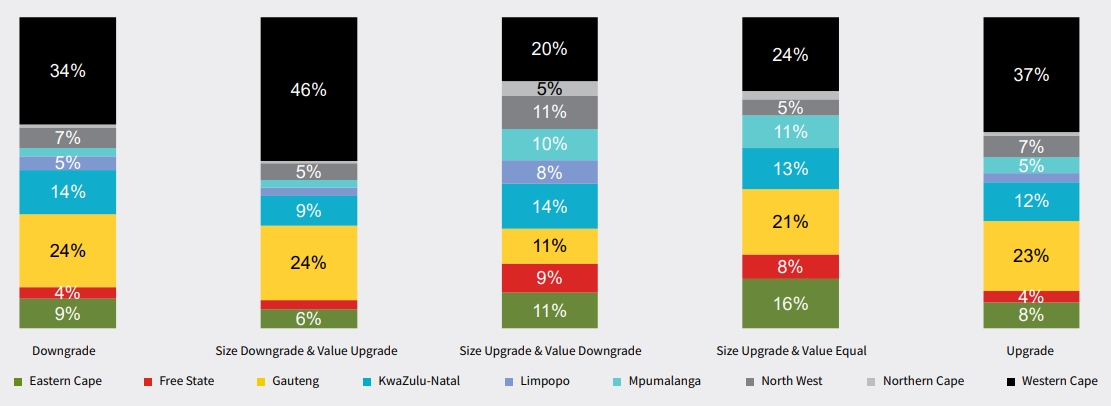
Interestingly, 46% of buyers moving to the Western Cape (graph above) are more likely to move to a new property of greater value and smaller size, while 34% will downgrade size and value and 20% will upgrade size and downgrade value.
Overall, (graph below), more people are downgrading (24% in 2015 to 27% in 2021) while less people are upgrading (37% in 2015 to 34% in 2021). Those upgrading had in fact fallen to 33% in 2019 and 2020, and the increase in 2021 might be a result of more people moving into larger homes which offer greater work-from-home flexibility.

Solutions that simplify the complex
Our new website makes it easier to navigate and discover a range of Lightstone products and solutions that make it easier for you to do business.

One place to access your subscriptions
We’ve simplified the complex with a single sign on functionality. Simply login and you will have access to all the products that you currently subscribe to. All in one portal.

What’s happening to the old website?
A few links on our new website may redirect you to certain pages on the old website. This is just a temporary solution to ensure legacy users still have access to certain products.
.png)
.png)
.png)
.png)