Auto Insights Newsletter | August 2021
Live Scans up on pre-Covid levels
Total scans
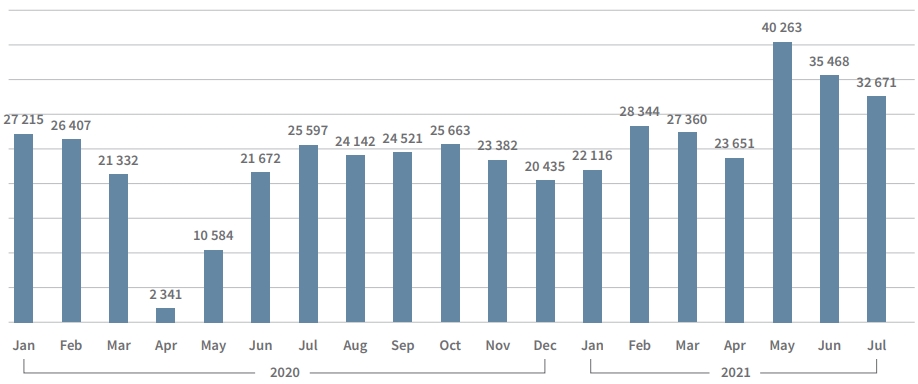
The cumulative number of scans at end July 2021 is 36.16% higher than the corresponding period last year – and this is despite growth being stunted by the stricter lockdown regulations in Gauteng.
The scans in July were 19% down compared to May 2021, the record month by some distance over the past 19 months.
January and February 2020 were the last two months (in the graph above) before the lockdown restrictions were introduced, and the full impact is evident in April 2020.
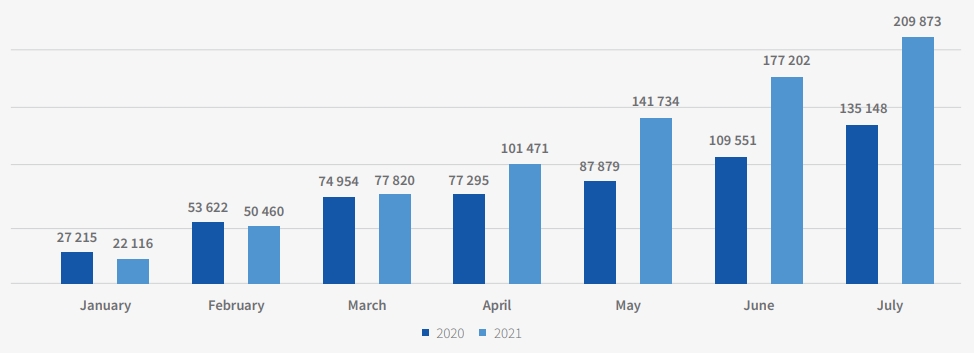
After a slow start to 2021, we noted that at the end of March 2021 the cumulative volumes were only 4.13% higher than the end of the corresponding period in 2020.
Cumulative number of scans
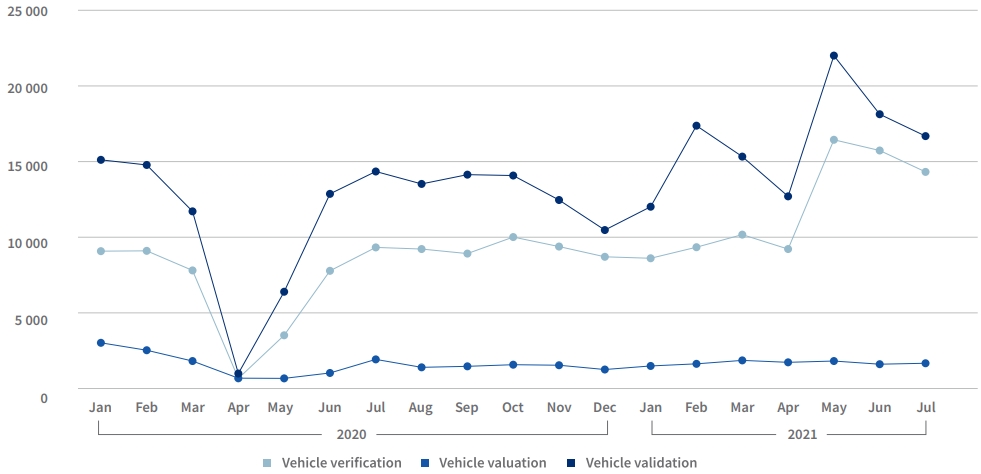
Scans on LIVE (graph below) are broken down into three distinct products – Verification, Valuation and Validation.
Following a strong recovery after the hard lockdown, validations tapered off towards the end of 2020. This increased dramatically in Feb 2021 with a 44.4% month-on-month increase from January.
Vehicle verifications have shown more stable growth since the hard lockdown, and at end July 2021 are at pre-Covid-19 levels.
Vehicle valuations are a much smaller portion of the LIVE scans and are slowly increasing back to pre-Covid-19 levels.
Total scans on LIVE by package
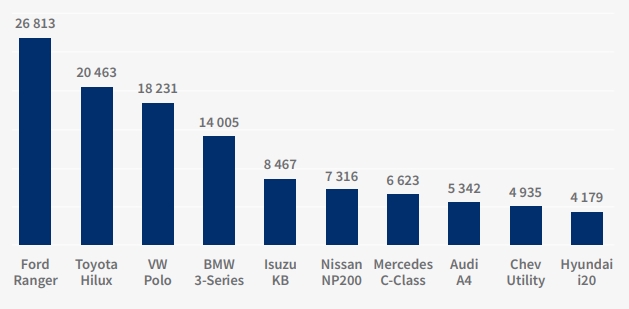
Brand scans
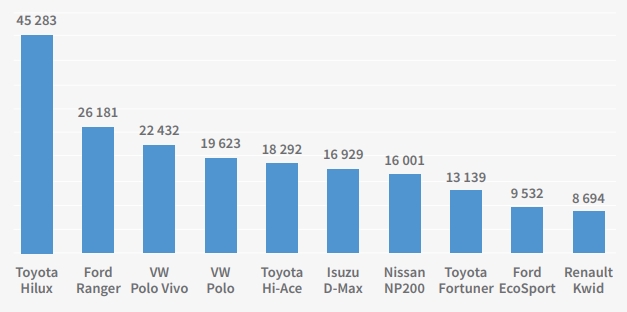
The Ford Ranger remains the most popular vehicle in the used market, with Toyota Hilux, VW Polo and BMW 3-Series making up the top four as at end of May. The VW Polo Vivo has dropped off the top ten, as have the Ford Fiesta, the Toyota Fortuner and the Ford EcoSport.
The Isuzu KB has moved from eighth spot to fifth, the Nissan NP 200 from ninth spot to sixth, and newcomers Merc C Class, Audi A4, Chev Utility and Hyundai i20 make up the last four positions.
Total scans: January 2020 to July 2021
The top nine of the 10 most popular vehicles (graph to the right) sold in May held their position, with just Renault entering the table in tenth spot, replacing the VW-T Cross.
Most popular new vehicles
(January 2020 - July 2021)
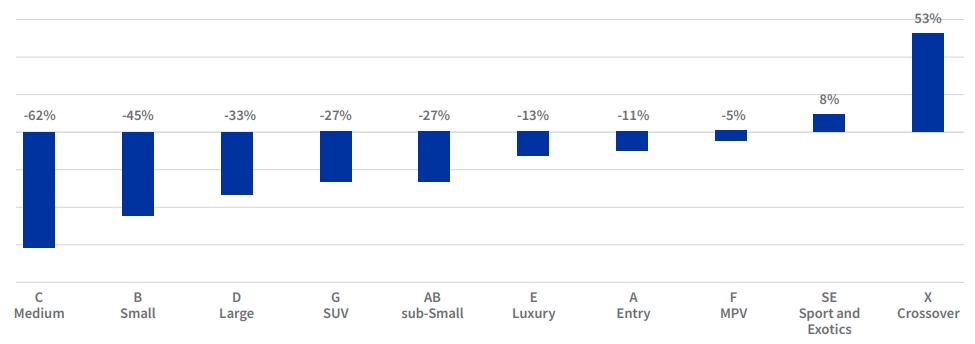
There has been some change in the segment level sales (graph below). AB sub-Small and SUV’s have switched positions. E-Luxury has fallen two spots, A-Entry has moved up one spot and F-MPV has climbed one spot.
Growth in 2021: to end July segment level sales
Signio volumes up during 2021
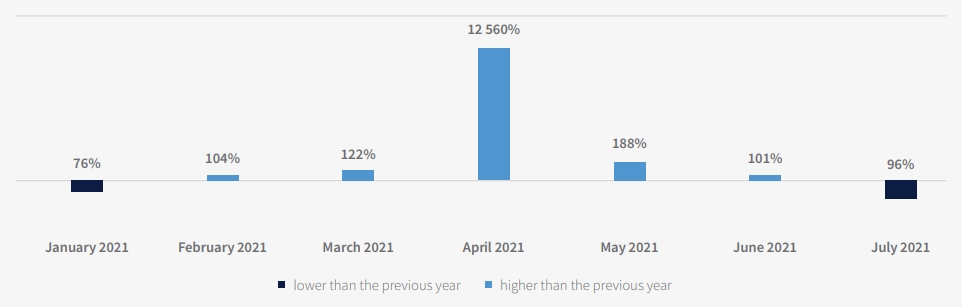
Monthly applications
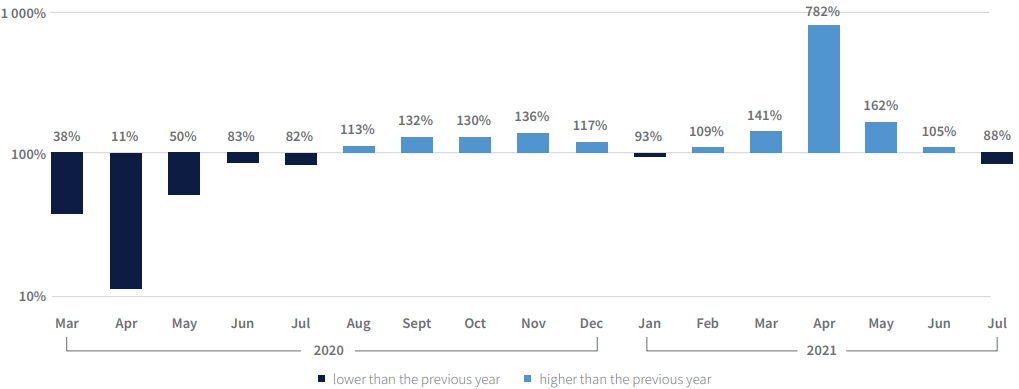
Ratio of current month’s applications relative to same month in previous year (Value higher than 100% indicates that there were more applications than in the same month of the previous year)
Although 2021 started slowly, Signio application volumes (graph above) have increased during the year.
In March, volumes were 40.85% higher compared to the same month in 2020 and comparable to volumes in 2019. There was a huge increase in April of 782% over the April 2020 period when the hard lockdown was in effect.
Growth has slowed in July 2021, probably as a result of Gauteng experiencing Level 4 Lockdown and unrest in both KZN and Gauteng. The lower volumes in July 2021 marked the first month of lower numbers this year compared to 2020.
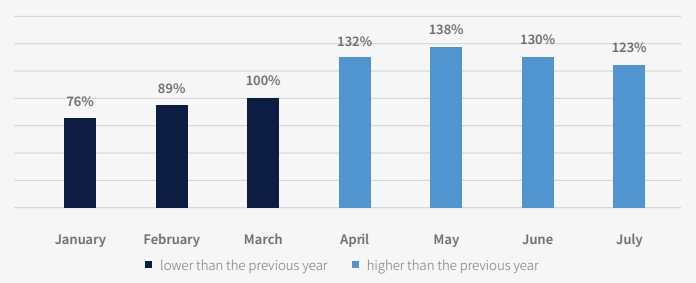
The good growth in March moved Signio applications in 2021 ahead of 2020 and are still tracking higher in 2021 despite slowing since May (graph to right).
Cumulative applications
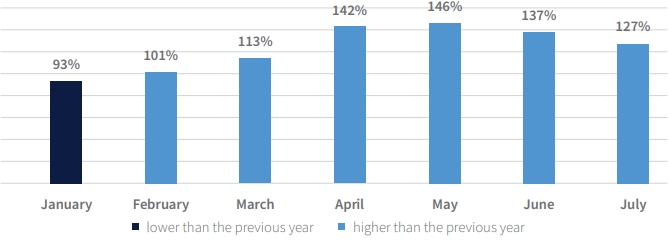
Ratio of cumulative applications in 2021 relative to the same month in previous year (Value higher than 100% indicates that there were more applications than in the same month of the previous year)
Monthly applications compared: 2020 - 2021
Ratio of current month’s applications relative to same month in previous year (Value higher than 100% indicates that there were more applications than in the same month of the previous year)
The number of paid out deals on Signio made a quick recovery to pre-Covid-19 levels during 2020. Payouts dropped by 24% year-on-year in January but recovered after a strong March in 2021.
Cumulative Signio applications at the end of each month
Cumulative payouts (see graph to left) are 38% higher at the end of May 2021 compared to May 2020. Again, we see the effect of the lockdown and unrest slowing activity down in July 2021, although cumulative payouts were still higher in July 2021 compared to July 2020.

Solutions that simplify the complex
Our new website makes it easier to navigate and discover a range of Lightstone products and solutions that make it easier for you to do business.

One place to access your subscriptions
We’ve simplified the complex with a single sign on functionality. Simply login and you will have access to all the products that you currently subscribe to. All in one portal.

What’s happening to the old website?
A few links on our new website may redirect you to certain pages on the old website. This is just a temporary solution to ensure legacy users still have access to certain products.
.png)
.png)
.png)
.png)