Auto Insights Newsletter | June 2022
Assessing the contribution of big OEMs to SA’s new vehicle sales
…and is a changing of the guard possible soon?
Do 20% of unique derivatives account for 80% of vehicles sold?
In this article we set out to explore if the Pareto Principle holds true for the auto industry in the period 2010-2022 across the Passenger and Light Commercial Vehicle markets.
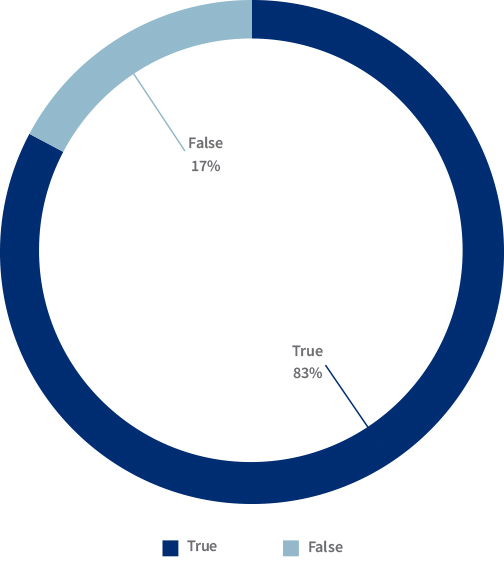
The distribution of new vehicle sales by derivative over the period tells us that just 16% of derivatives accounted for 84% of new vehicle sales.
Figure 1: Distribution of new vehicle sales by Car ID class (Top 20% or not)
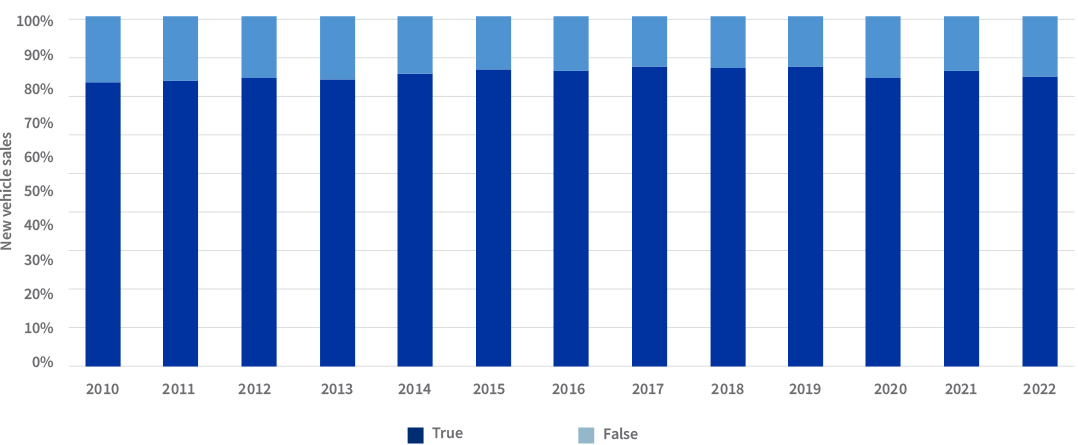
The distribution of new vehicle sales for the individual years is shown in Figure 2, and we see the 80:20 pattern holds true, and in some years drifts towards 85:15.
Figure 2: Distribution of new vehicles 2010 - 2022
This poses the question; will the status quo be challenged in the near future?
We can investigate this by inspecting the skewed nature of new vehicle sales and determining the most popular vehicle makes over time.
In the animated GIF below (Figure 3) we see the top 10 most popular makes for new vehicle sales, with Toyota and Volkswagen ranked first and second respectively over the entire period. Toyota and Volkswagen have been the “top dogs” since at least 1994 when Lightstone’s database of new vehicle sales data began.
Furthermore, Chevrolet, BMW, Mercedes and Audi all fell out of the top 10 over the last 10 years and have been replaced by rising stars Suzuki, Renault, Isuzu and Haval. Suzuki’s popularity has grown most over the last few years – it only entered the top ten in 2019 and by June 2022 was ranked third in the country. This can be attributed to the large share of sales coming from vehicles manufactured in the booming Indian economy.
Figure 3: Top 10 makes for new vehicle sales 2010 – 2022
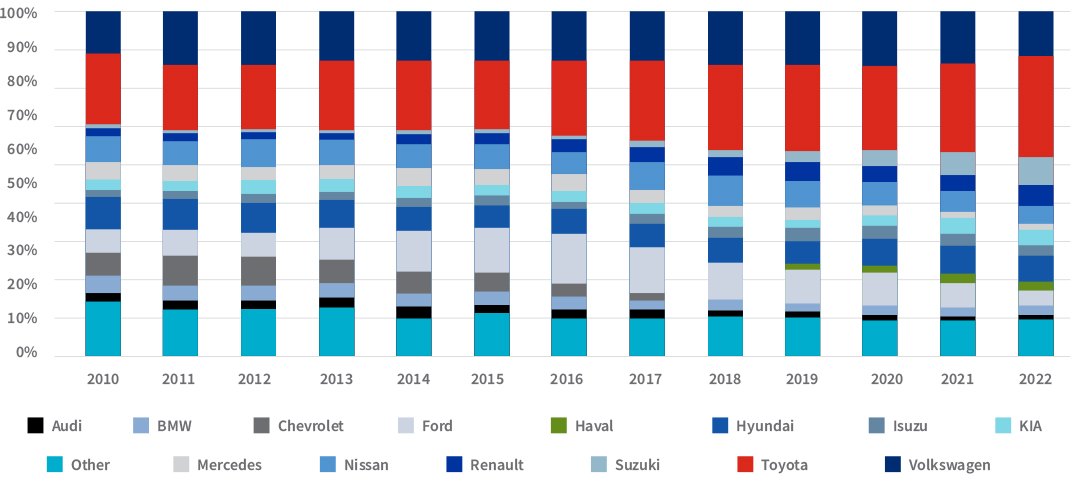
In Figure 4 we can see how Toyota (red) and Volkswagen (dark blue) have dominated the new vehicle sales market over the period. While Suzuki (steel blue, third bar from top) has seen a significant rise in sales over the last few years it still pales in comparison to the sales achieved by the top two vehicle makes.
Figure 4: Distribution of new vehicle sales by make; 2010 – 2022
The data suggests the distribution of new vehicle sales is far from uniform when stratifying by derivative or vehicle make, and the popularity of vehicle makes can change drastically over time, with almost half of the current top 10 most popular makes not being big players in 2010.
Toyota’s dominance has been consistent over the period, with closest competitor Volkswagen never coming close to dethroning them.
In April this year the Toyota Prospecton vehicle manufacturing and assembly plant was severely impacted by the devastating flood in KwaZulu-Natal. Vehicles and equipment were badly damaged, and production is expected to be disrupted for the rest of the year. Toyota utilises a just-in-time production schedule, and so a setback of this magnitude will no doubt have a great effect on their sales.
Thus far, Toyota seems to have maintained its lead in the market, although Figure 5 suggests this could change.
Figure 5: Change in Toyota sales figures; Mar 2022 - Apr 2022
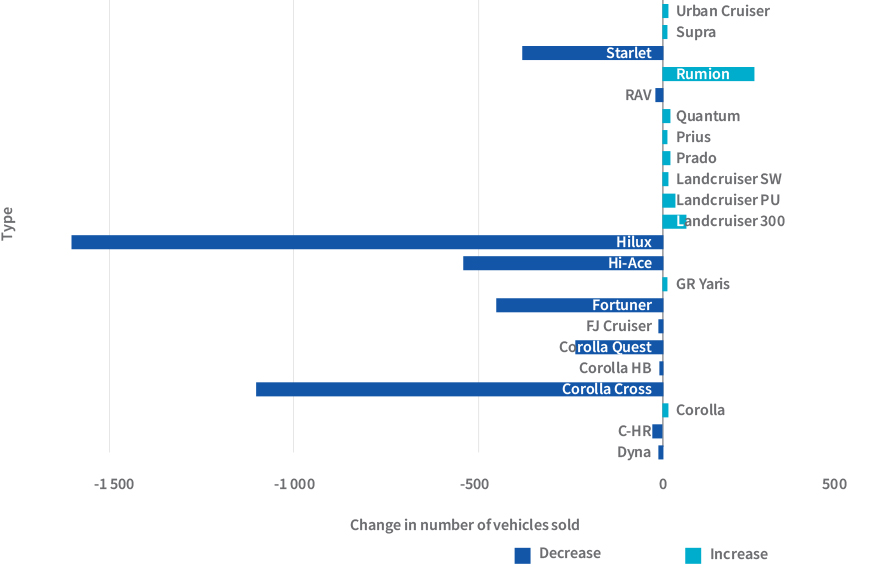
Historically, Toyota’s breadth of product offerings has counted in its favour. For example, the Landcruiser Pick-Up is a viable alternative to the Hilux. Similarly, the Urban Cruiser and Rumion are alternatives to the Corolla Quest.
In Figure 5 we can see that as the sale of the more popular vehicle types decreased (most likely due to a lack of available stock), while the sales of less popular types have increased marginally. This means that despite declining sales, Toyota has maintained high sales volumes.
The only way Toyota could lose its status as the leading brand is if smaller brands ate away at Toyota sales in the categories in which they operate, and Volkswagen held or increased its sales in the categories in which it operates. But given the quantity of products Toyota offers, this seems unlikely.
.png)
.png)
.png)
.png)