Property Newsletter | November 2021
How data helps mitigate risks
Data is increasingly being used to help the insurance industry better underwrite and price its property risk exposures – and Lightstone’s indices and metrics include residential property Replacement Cost Valuations (RCV) and risk indices for flooding, lightning, hail, fire, subsidence, earthquakes and crime.
What Lightstone measures
- Flooding: Assigns a risk index based on the distance and altitude from a water source, with consideration for the type of water source, eg perennial or non-perennial.
- Lightning and hail: Measures a property’s exposure to lightning and hail damage based on the reported lightning density per square km, adjusted for altitude.
- Dolomite: Identifies whether a property is situated on ground consisting of dolomite and estimates the risk of sinkholes based on proximity to mines and other sinkholes.
- Earthquakes: Analyses whether a property is located in an earthquake-prone region based on historical tremor intensity and frequency.
- Crime: Offers a comprehensive risk index and trends for various categories of crime, such as contact crime or property related crime, based on official SAPS data which is mapped spatially.
- Proximity: Reviews the distance of the property from several key points of interest such as police stations, fire stations and airports.
The data in this story focuses on fire and flooding risks in specific areas within certain provinces from 2002 to 2020.
Fighting fires
The fires in Cape Town in the Western Cape in April this year were estimated to have cost insurers around R1 billion. The losses from the fires that left a trail of devastation through Knysna and Plettenberg Bay in 2017 totalled R3.3b.
The question is: what if some of the risk could be calculated ahead of time based on accurate historical data and insights? How could assessing accurate data enable both public authorities and private owners to better prepare for fires – and so limit damage?
The question is: what if some of the risk could be calculated ahead of time based on accurate historical data and insights? How could assessing accurate data enable both public authorities and private owners to better prepare for fires – and so limit damage?
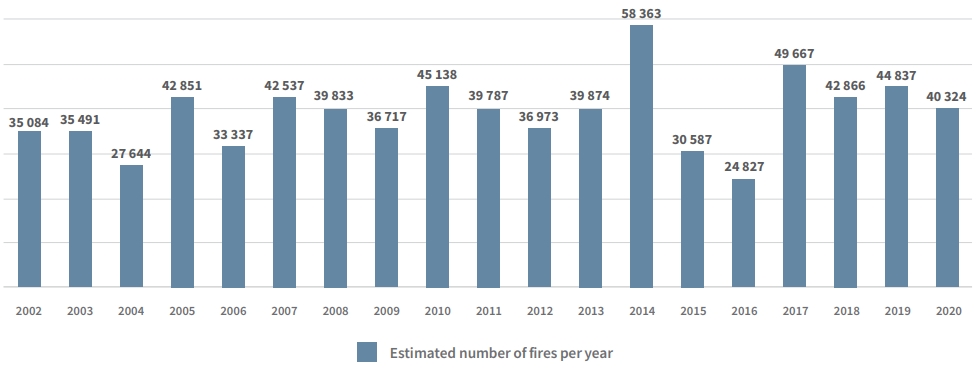
Satellite imagery analysed by Lightstone over 18 years pinpoints 2014 as the worst year for fires, with the number of fires that year at 58 363, followed by 2017 with 49 667 fires.
Estimated number of fires per year
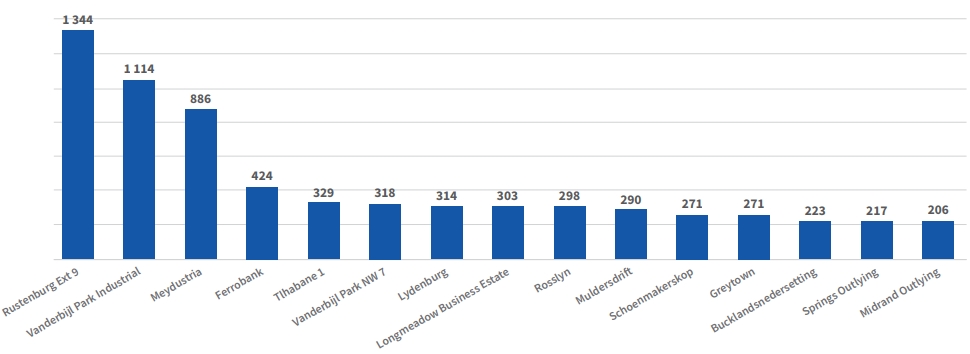
The three suburbs which experienced the greatest number of fires over 18 years were Rustenburg Ext 9 in the North West, Vanderbijl Park Industrial and Meydustria in the south of Gauteng, with 1 344, 1 114 and 886 average fires respectively.
“Having access to this type of risk data provides invaluable support to businesses, especially in the banking and insurance sectors, when developing products for clients,” says Mike Lehabe, Head of Financial Services for Lightstone.
Top 15 suburbs with highest total fires 2002-2020
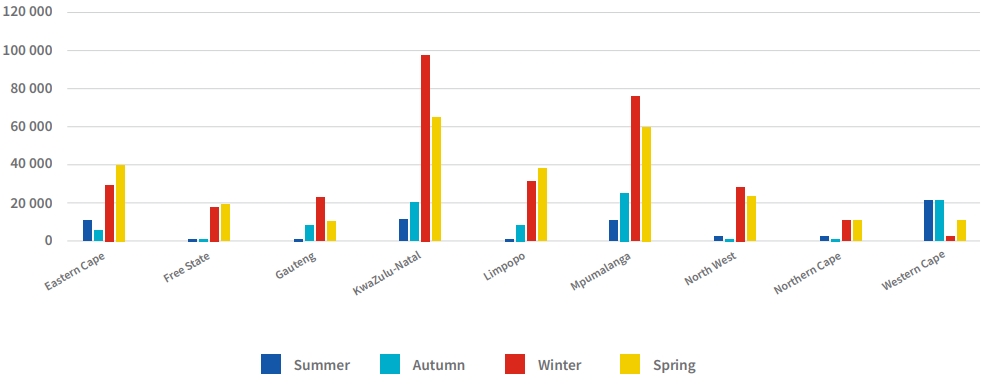
KwaZulu-Natal’s winter season presents the highest number of average fires over the 18-year period at 95 410, followed by Mpumalanga’s winter season fires at 75 437. For the Eastern Cape and Mpumalanga, spring presents a higher risk of fires in comparison to other seasons.
Total occurance of fires per province per season between 2002 and 2020
Floods
The Kwa-Zulu Natal floods that swept across the southern region of the province in 2019 were estimated to have cost R658m in repairs to damaged roads and infrastructure.
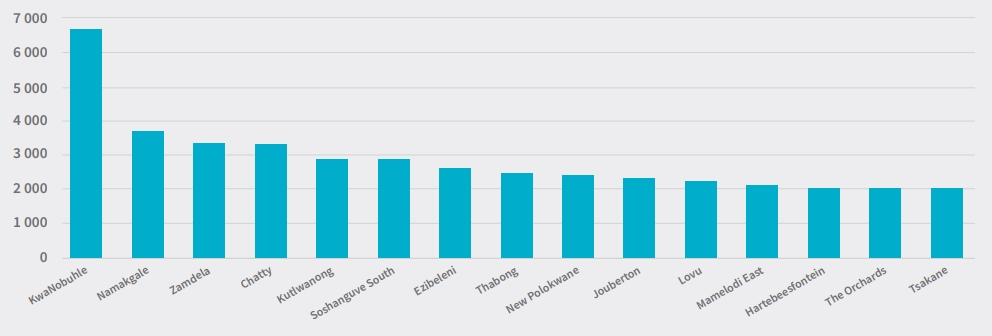
When Lightstone looked at flooding data for the same 18-year period, KwaNobuhle, a large informal settlement on the outskirts of Uitenhage in the Eastern Cape, was identified as the highest flood risk area.
We came to this conclusion based on data which examines an area’s proximity to the closest body of water, its elevation over that body of water, the number of properties per suburb, where the area was lower than its nearest body of water, and if the distance to that body of water was less than 500m. All these factors help us predict if an area is at risk of flooding should the body of water get too much rain
Top 15 suburbs by properties at risk of flood

Solutions that simplify the complex
Our new website makes it easier to navigate and discover a range of Lightstone products and solutions that make it easier for you to do business.

One place to access your subscriptions
We’ve simplified the complex with a single sign on functionality. Simply login and you will have access to all the products that you currently subscribe to. All in one portal.

What’s happening to the old website?
A few links on our new website may redirect you to certain pages on the old website. This is just a temporary solution to ensure legacy users still have access to certain products.
.png)
.png)
.png)
.png)